
Linear Price Bar Indicator
Forex market trends from the best Linear Price Bar Indicator for MT4. Find market trends with the help of bars.
Description
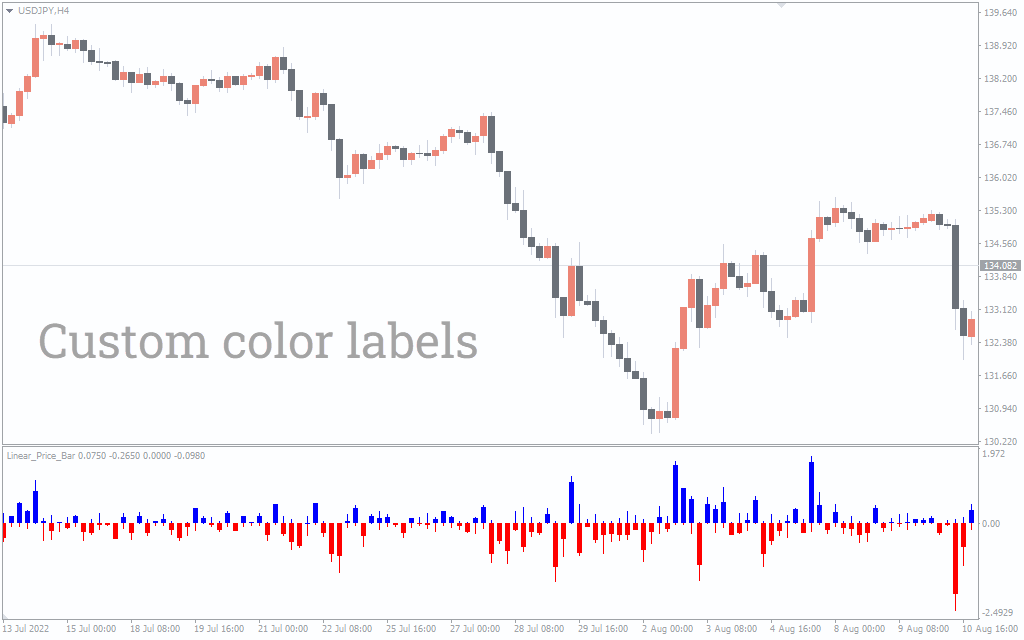
The Linear Price Bar Indicator is a simple MT4 indicator that determines the market trend. There are two key components of the indicator; zero line and bullish/bearish bars. The zero line act as a center line, and the bars appearing above or below it determines the trend’s direction.
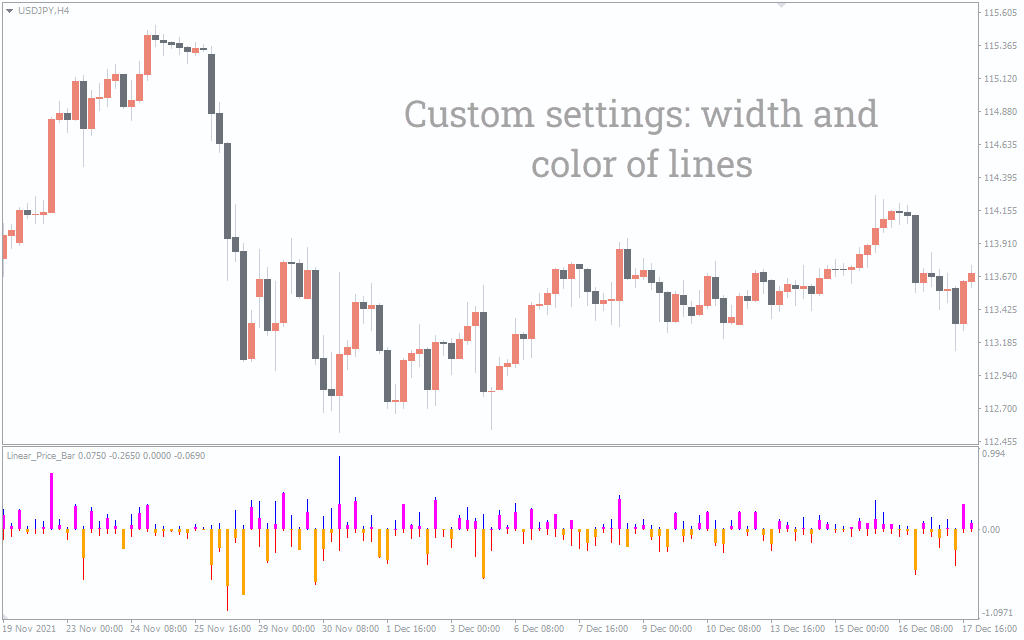
There are two types of bars in Linear Price Bar Indicator; bullish (blue) and bearish (red). These bars follow the price action and go above or below the zero line. The good thing is you can apply the Indicator on all timeframes. However, applying it on longer timeframes is best to get an overall view of the market trend.
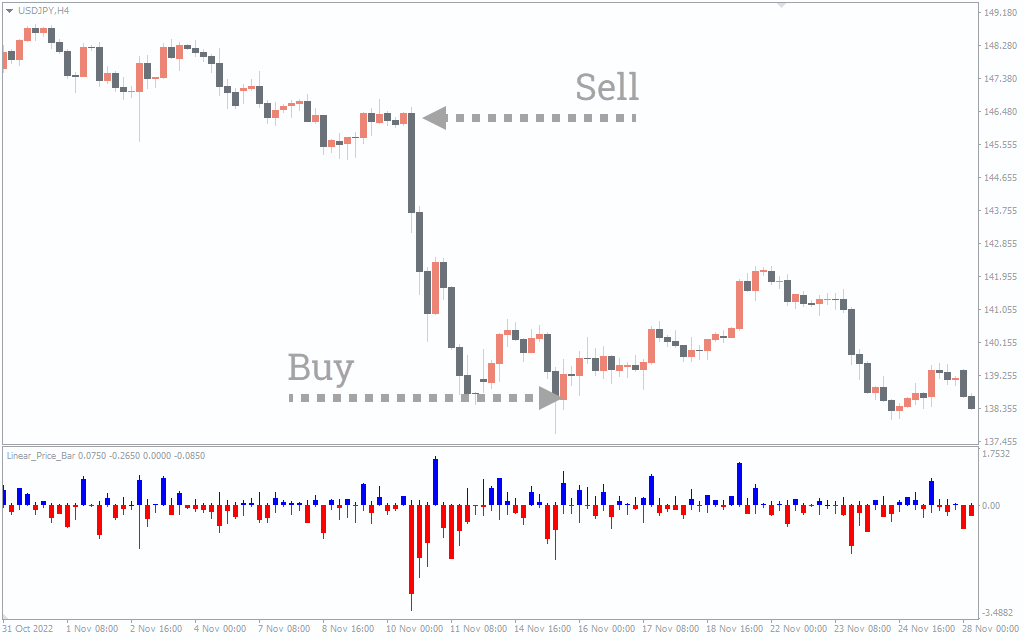
The above USD/JPY H4 chart shows the Indicator’s BUY/SELL signals. To find out BUY/SELL signals, you have to look at the zero line and the bars. When the blue bars start to appear, you can look for a long position. On the other hand, if the red bars emerge, you can go short.
It’s important to note that these bars follow the price action, so different bars can appear within the main trend. For instance, blue bars appear in the downtrend. So, it’s better to use other indicators along with the Indicator to confirm signals. Also, you have to wait as the bars appear because the bars can change color.
Conclusion
The Linear Price Bar Indicator for MT4 determines the market trend by plotting bullish and bearish bars. These bars help in finding trend continuation and a reversal. Linear Price Bar Indicator is free to download from our website.