
Dynamic Liquidity HeatMap Profile Indicator
Dynamic Liquidity HeatMap Profile Indicator for MT4 visualizes buy and sell liquidity zones to identify key price levels and market reactions.
Description
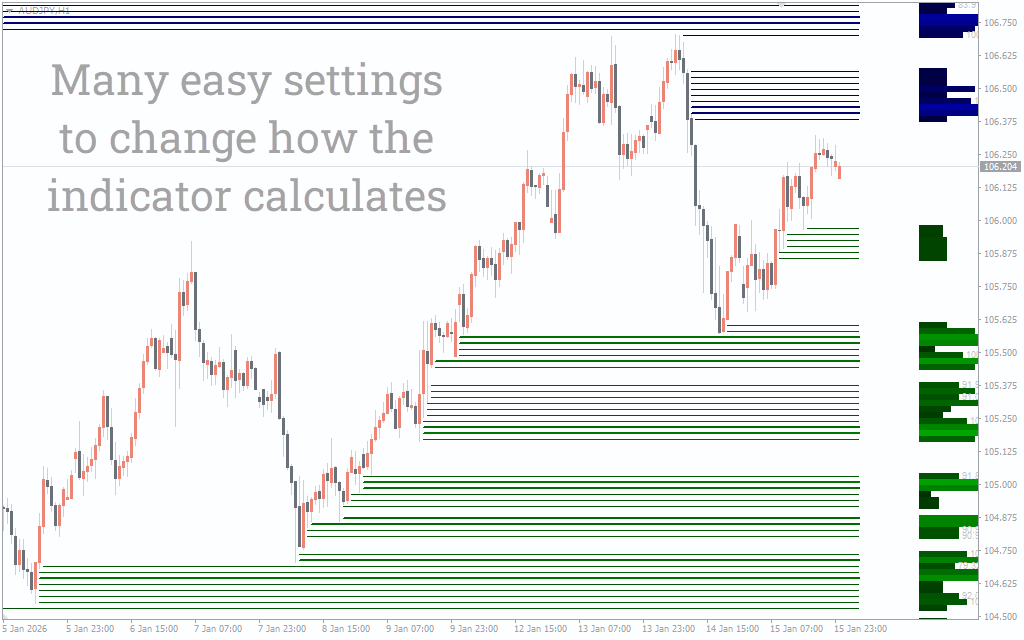
The Dynamic Liquidity HeatMap Profile Indicator for MT4 is a useful market analysis tool that illustrates where liquidity is concentrated across different price levels. Unlike looking at the positioning of large players, this indicator displays liquidity zones on the chart with the help of a heatmap-style profile. Based on my trading experience, I find this kind of visualization invaluable when studying market structure, particularly during consolidation phases or before strong impulsive moves.
This indicator uses historical price data for a specified number of bars and builds the horizontal liquidity profile. Strong liquidity areas often act as magnets for price or as major reaction zones, making them highly relevant for both intraday traders and swing traders.
Dynamic Liquidity HeatMap Profile Indicator Trading Signals
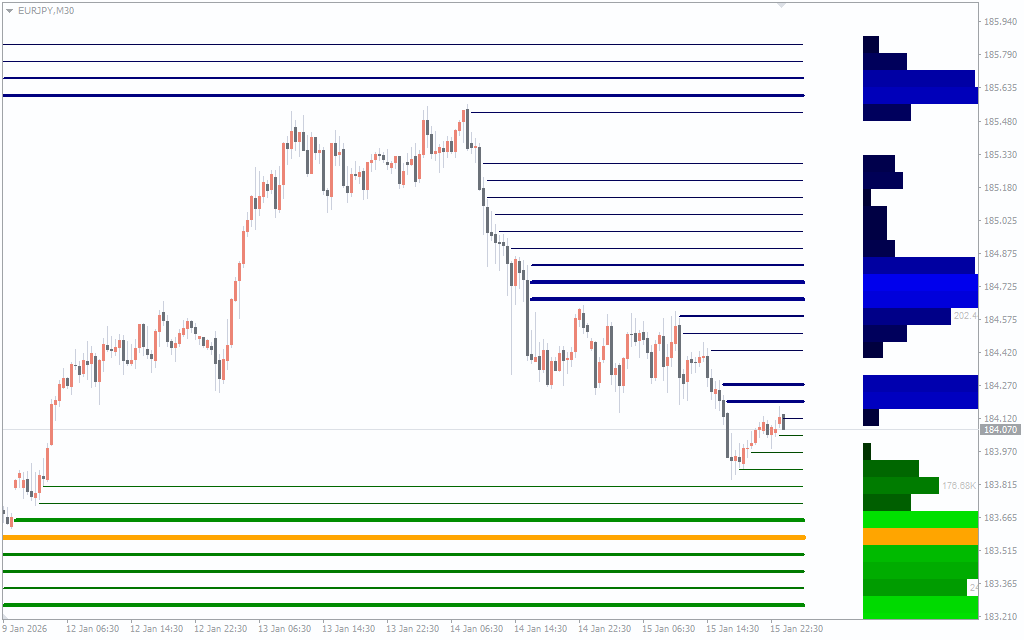
The indicator does not generate classic arrow-based buy or sell signals. Instead, it provides contextual trading information by highlighting zones of high and low liquidity. When price approaches a strong liquidity cluster, it often reacts with either a bounce or a breakout, depending on market conditions. I observe closely price behavior in dense liquidity zones in practice. Sharp rejections tend to signal strong defense from market participants, while slow absorption followed by continuation signals a breakout.
High-liquidity zones above price frequently act as resistance, while those below price behave as support. The highlighted maximum liquidity point is especially important because price tends to revisit this level multiple times. Combining these zones with price action, market structure, or session timing significantly improves trade timing and risk management.
Conclusion
Dynamic Liquidity HeatMap Profile Indicator for MT4 is an extremely useful tool for traders who prefer fundamentals to simple signs, as they concentrate their attention on liquidity, market structure, and key price levels. In my opinion, it’s most useful as a decision-support indicator, helping to understand where price is likely to react, rather than when to directly enter the market. With solid price action analysis and proper risk management, this indicator can greatly boost trade quality and confidence, especially in market environments that are highly volatile or are range bound.