Doji Reader Indicator
Make the best forex & stock buy-sell decisions using the auto Doji Reader indicator for MetaTrader 4. Suits price breakout & trend reversal trading strategies.
Description
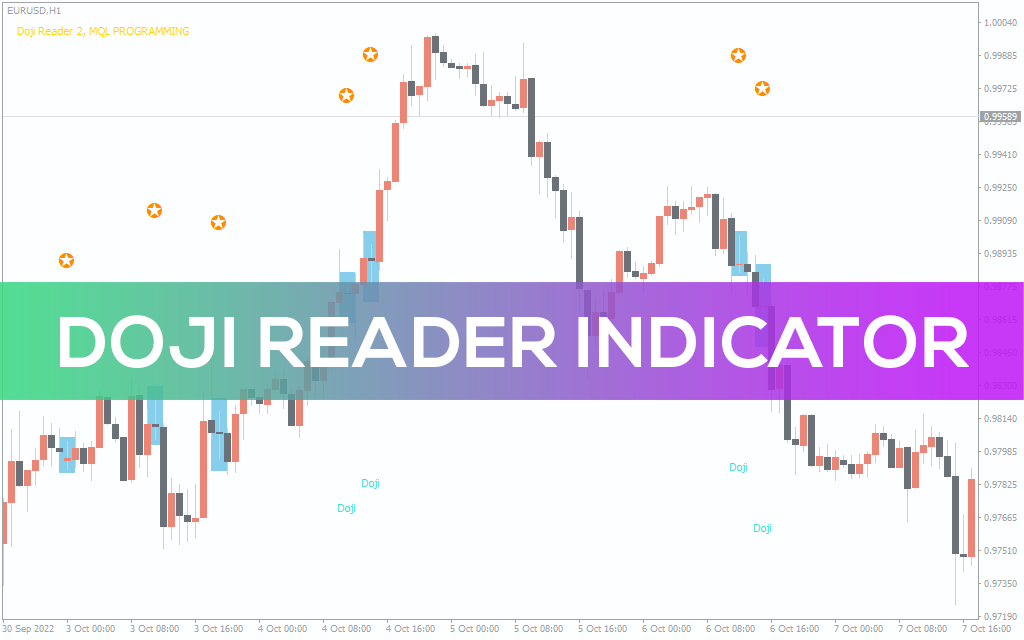
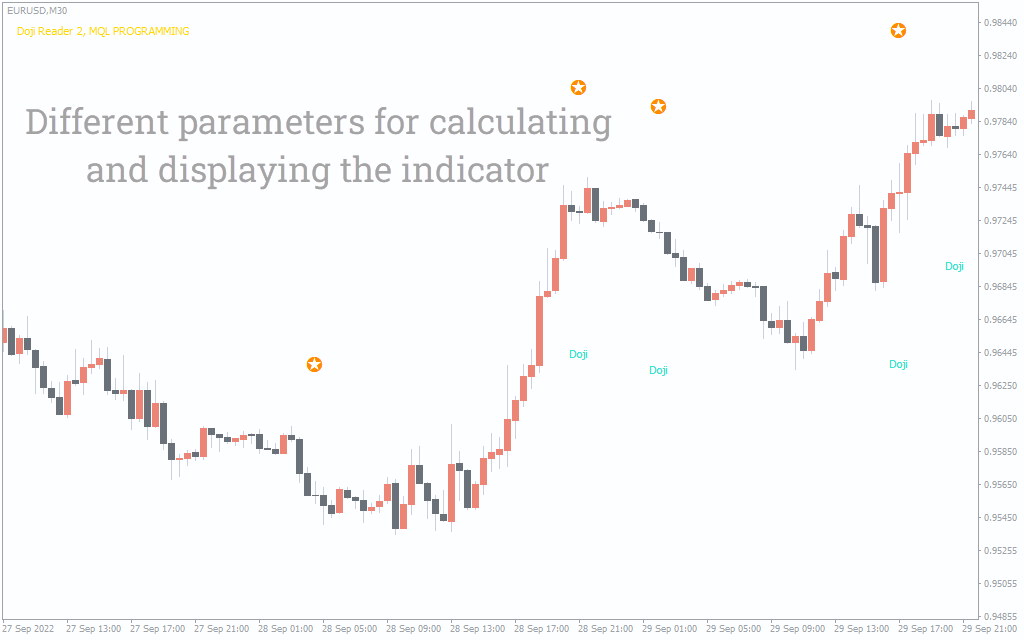
The Doji Reader is an automatic MT4 candlestick pattern detector. It spots perfect Doji patterns that lead to profitable price breakouts and trend reversal trading opportunities.
Technical forex and stock traders view gravestone Doji bars as a solid indication of an upcoming bullish or bearish price reversal. This pattern develops when an asset’s opening and closing prices are pretty close to one another and have a substantial upper shadow.
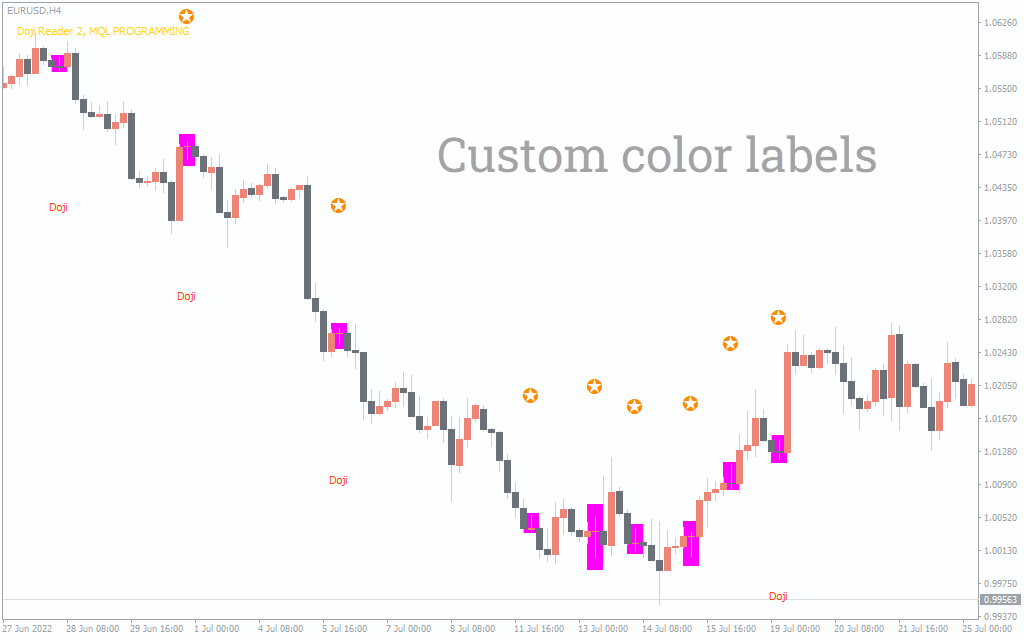
Once you install the Doji Reader on your MetaTrader platform, you’ll notice the indicator automatically starts to highlight potential Doji patterns. However, not every signal offers a perfect buy-sell opportunity. After you spot an ideal structure, you need to carefully make the trading decision based on the current trend, support/resistance, and risk-to-reward potentials.
How to Trade Forex and Stocks using the Doji Reader MT4 Indicator
A Doji candlestick pattern typically has a natural body of up to 5% of the entire candle’s range. Anything beyond that turns it into a spinning top. Another sign of trend weakness is a spinning top pattern.
It’s crucial to comprehend and spot patterns on trading charts for currencies, stocks, futures, or bonds as part of technical analysis for traders. So, it is essential be familiar with various chart patterns and their meanings and comprehend and spot trends.
For beginners, it is safe to trade Doji patterns within the current market trend. It doesn’t matter if you trade regular, gravestone, or dragonfly; this trading strategy applies to all Doji structures. Placing trades following the correct momentum increases the success probability of your entries.
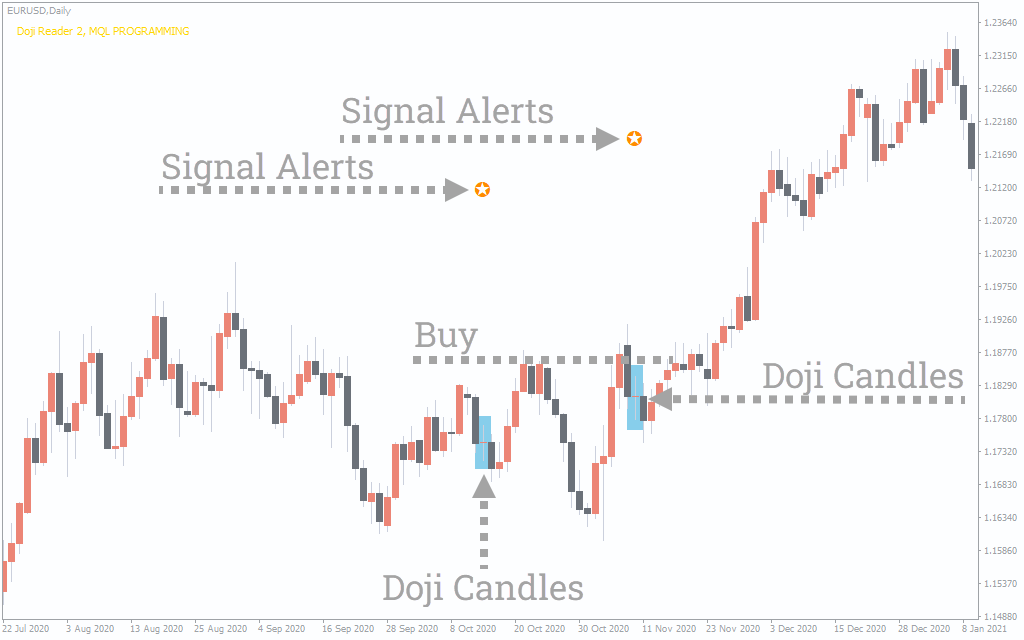
The above EURO vs. USD chart shows a perfect trend-following Doji trading setup. However, we’ve dismissed the first signal because it resulted in a bearish price breakout against the current bullish momentum. Although, the second Doji followed through a bullish price breakout that matched the current trend, offering a solid buy entry opportunity.
There is a high possibility that an uptrend will emerge in the days to come when the market has been in a bearish trend and hits a new low (which is lower than the prior three trading days) but is unable to hold that low.
Similar to the previous example, there is a significant possibility that a downward trend may start in the days to come when there has been an upward trend in the market, and the price hits the overbought zone. Particularly when an asset’s price reaches the top of the chart, fails to hold the high, and makes a sharp bearish move.
Conclusion
Trading with the Doji candlestick pattern might result in significant returns. Besides, all types of traders value this candlestick pattern’s adaptability to MTF charts. The Doji Reader indicator for MT4 helps beginners to spot regular, dragonfly, and gravestone patterns with automatic alerts.