Demand Index Indicator
Forex BUY and SELL signals from the best Demand Index Indicator. Find overbought and oversold conditions.
Description
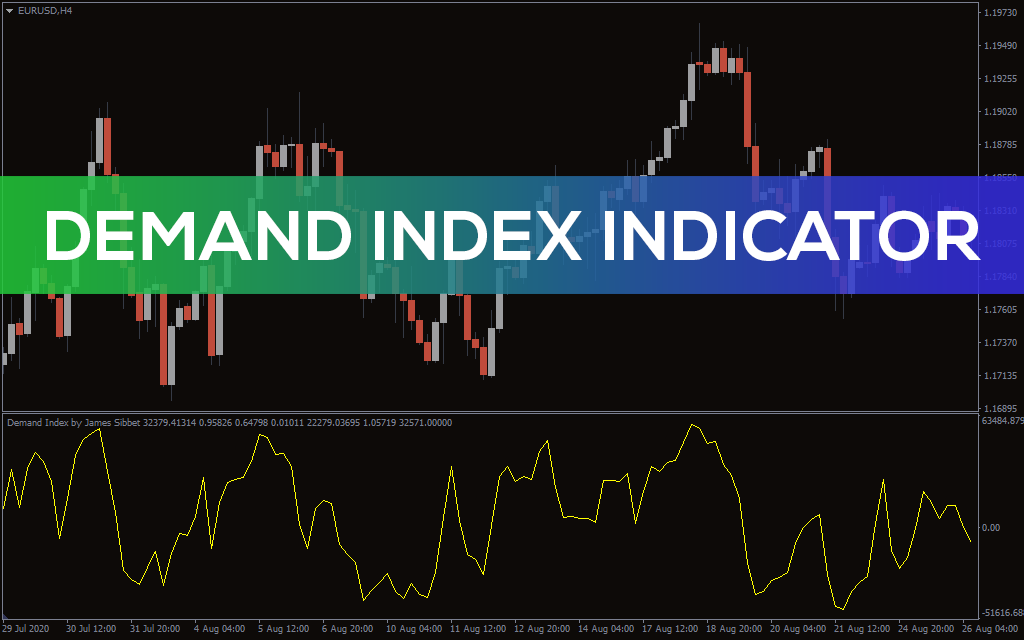
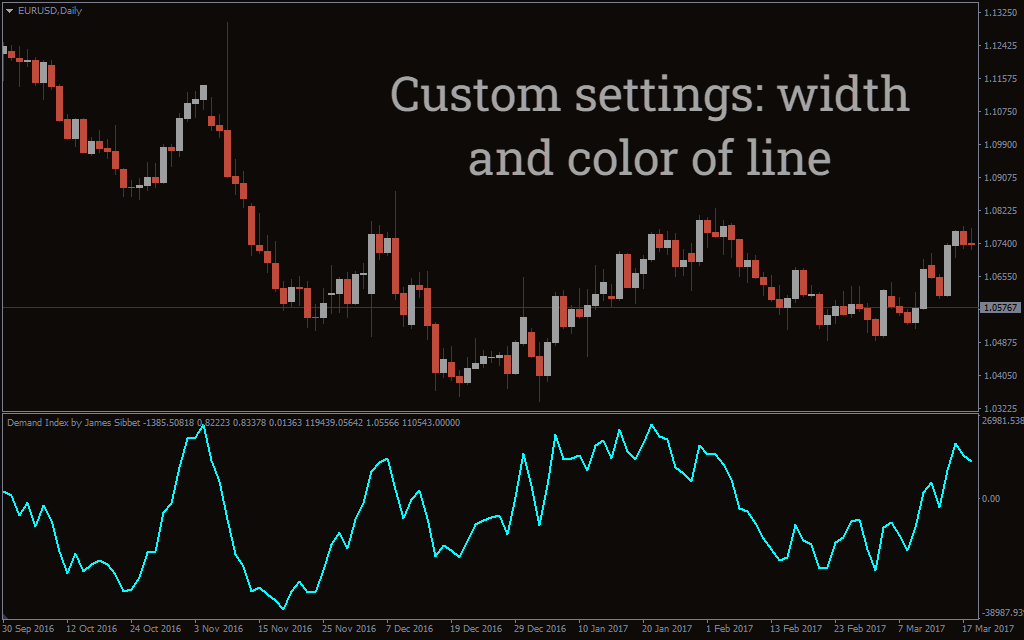
The Demand Index Indicator by James Sibbet is a simple MT4 momentum indicator. The indicator plots a one signal line to detect the market trend. Like many other momentum oscillators, the indicator tells about the overbought and oversold conditions.
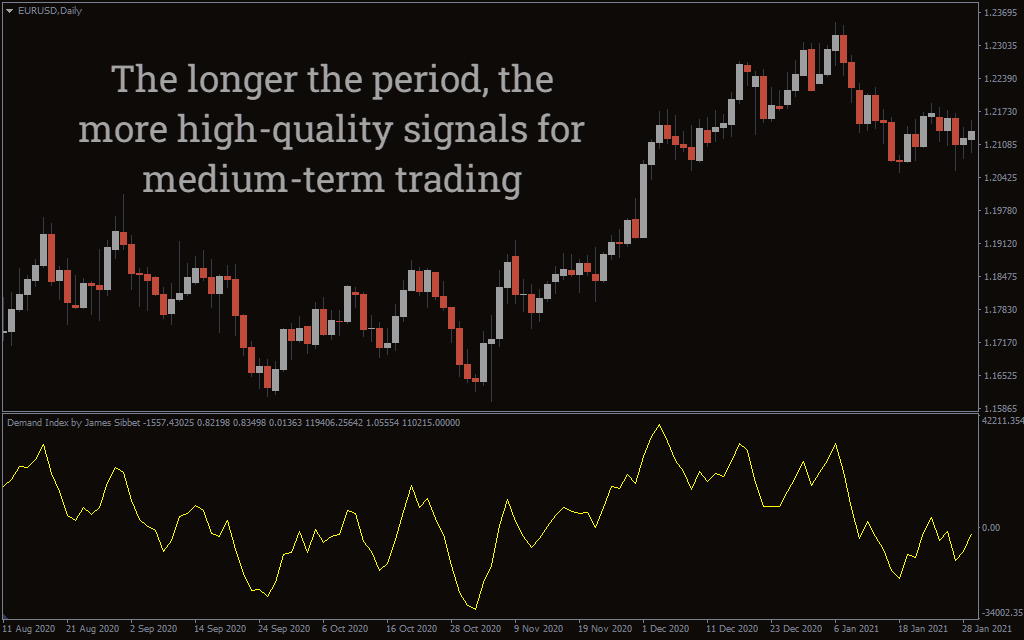
Similar to its counterparts, the Demand Index Indicator oscillates between specific ranges. Unlike the RSI, which oscillates between -100 and 100, the Demand Index Indicator, doesn’t have specific values. It changes according to the price momentum. The indicator works best in every timeframe. However, it’s best to apply it on longer timeframes.
Demand Index Indicator BUY/SELL signals
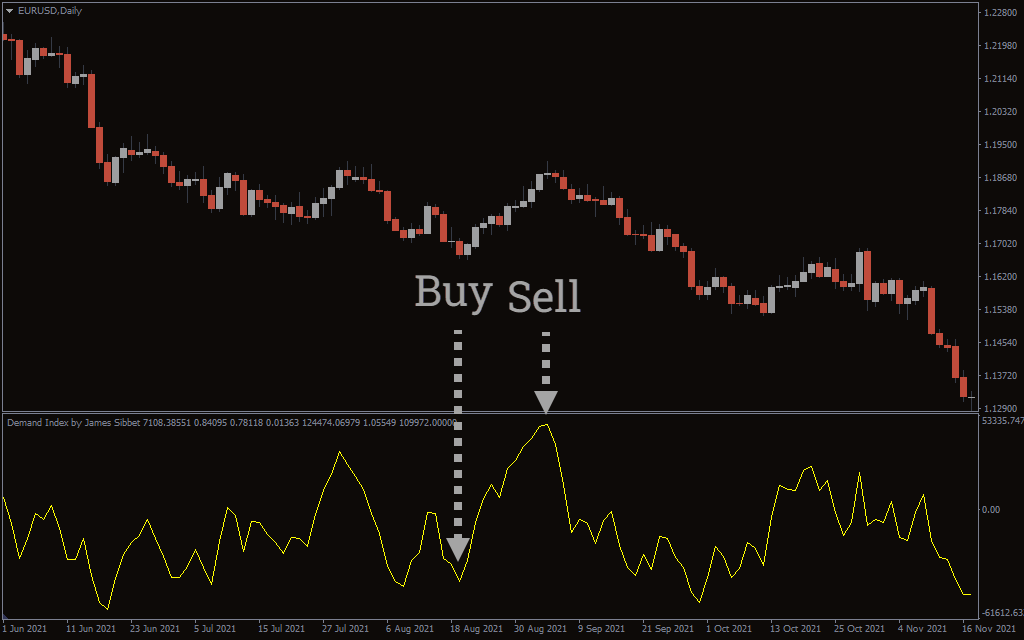
The above EUR/USD Daily chart shows BUY and SELL signals with the indicator. To determine the BUY and SELL signals, traders need to identify overbought and oversold conditions. When the indicator signal line is close to the upper level, it indicates a price reversal. Here traders need to take short positions and exit long ones.
On the flip side, when the indicator signal line is near its bottom range, it indicates an upcoming uptrend. Here traders should enter long positions and exit short ones. Although the indicator works best on its own, traders can apply other indicators like the RSI or MACD for further signal confirmation.
Conclusion
The Demand Index Indicator is a momentum oscillator that plots a signal line to determine overbought and oversold areas. It works like any other momentum oscillator. You can download the indicator for free from our website.