Cloud Indicator
A Cloud indicator is an excellent stand-alone indicator for identifying the trend’s direction and momentum.
Description
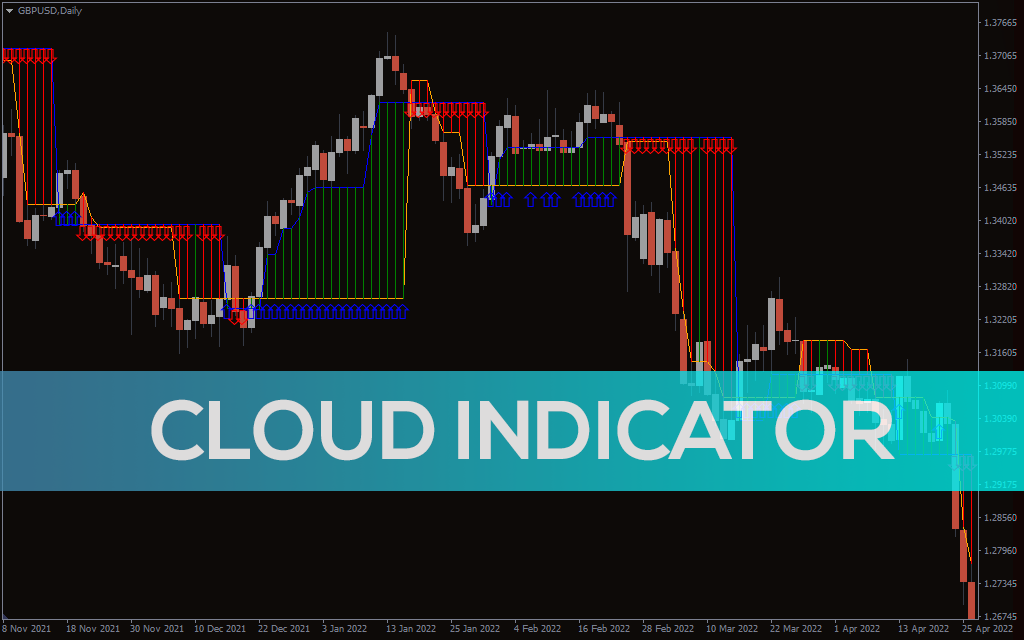
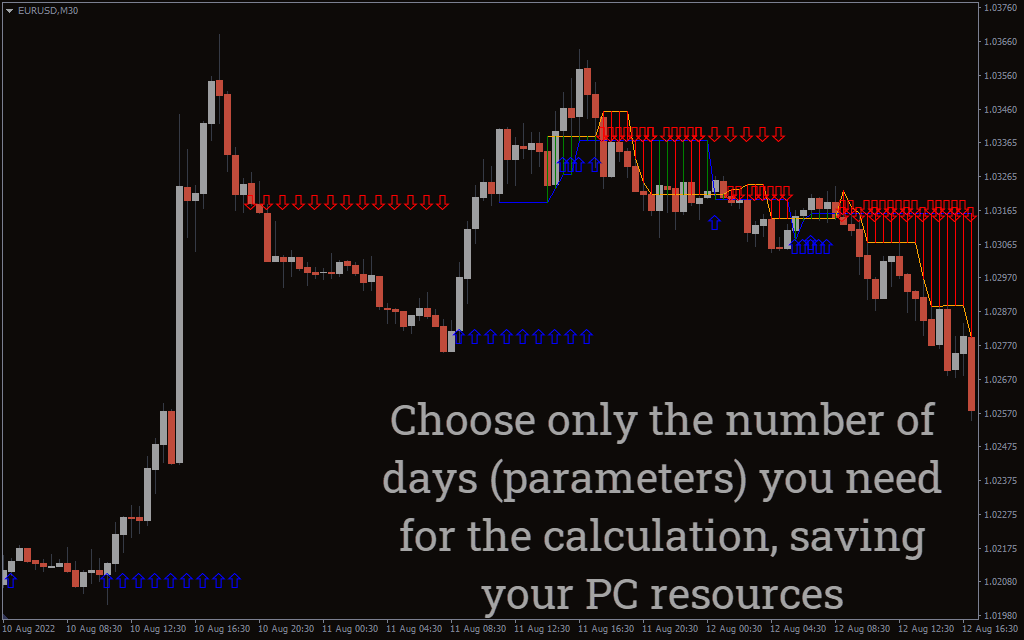
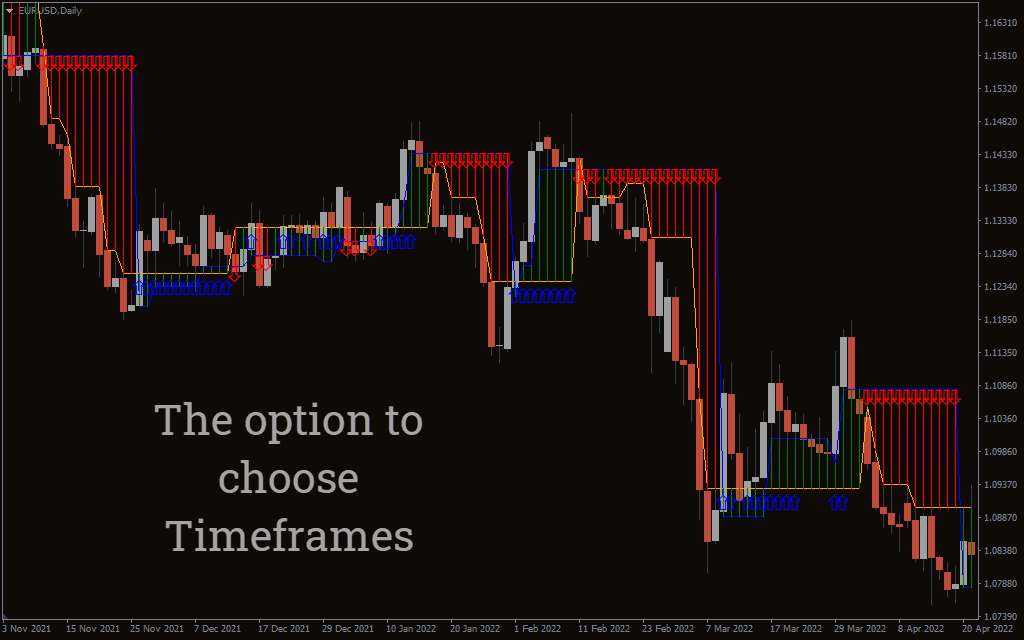
The forex indicator is similar to the Ichimoku cloud indicator. It draws a cloud using smoothed moving averages, eliminating the noise and enabling users to identify the trend easily. The cloud draws support and resistance, which allows you to determine the trend direction and strength and hence can be used to identify buy and sell signals. It also gives you alerts when there is a trading signal.
While you can use the indicator to trade any instrument, it works well in yen pairs. You Can use the indicator as a standalone tool without necessarily using additional technical tools.
How Cloud Indicator works
The indicator consists of a cloud made of layers of moving averages. The cloud changes color depending on the trend direction within a blue and yellow line. The indicator lines change color between green and red when the trend changes.
It does a good job identifying the market movement to ensure you are always on the right side of the trend direction. Since the market spends most of the time in the ranging market, you might see the indicator cloud changing color within the same level. You should therefore stay out of the market during the consolidating market and only open positions when after a breakout. Ensure the cloud extends in a specific direction to gauge the momentum.
Buy Signal
The indicator lines change color from red to green during an uptrend. In this case, the price action should be above the cloud channel.
Sell Signal
The indicator limes change from green to red during a downward trend. The price should also move below the cloud channel.
Exit Strategy
Exit when the indicator color changes from red to green and vice versa. In addition, you should use a protective loss.
Cloud Indicator Trade Example
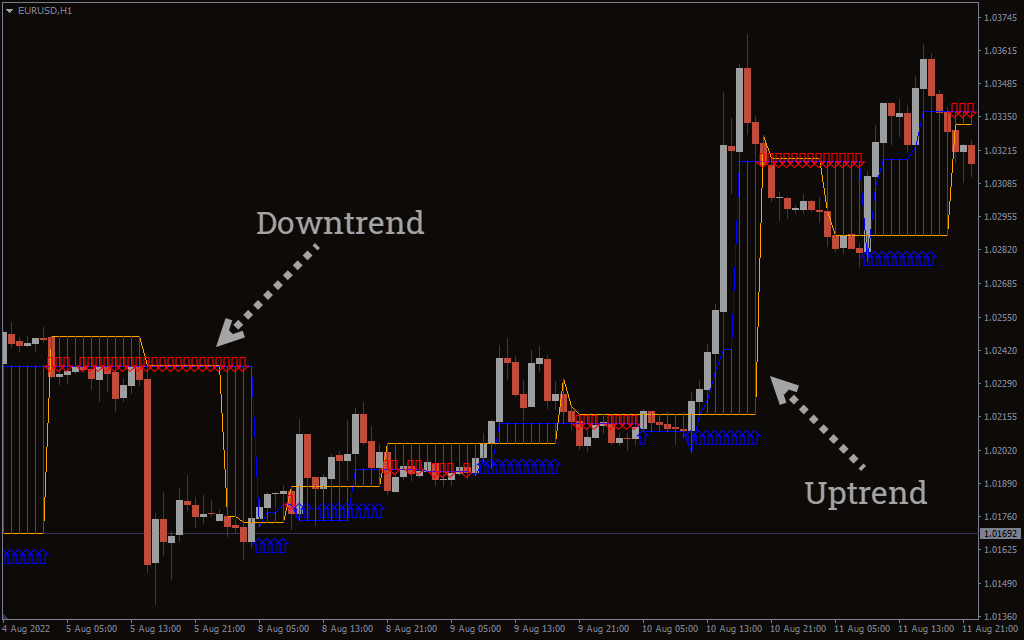
The chart above shows the price action of the Euro against the US dollar on a daily time frame. The price action crosses the indicator cloud from above and trends downwards below the cloud. Notice how the indicator cloud changes color from greens to red during the downtrend.
During a rally, the price action crosses the indicator from below and trends upward above the indicator cloud. The cloud color changes the red to green during the uptrend. The trend ends when the indicator cloud changes color from red to green and vice versa.
Conclusion
The cloud is pretty much an enhanced version of the Ichimoku cloud. It is smoothed to eliminate market noises. You should therefore use the indicator to identify the trend direction, market momentum, and signals. Essentially you only want to wait until the indicator color changes from red to green. During a downtrend, the indicator cloud is red but changes color to green. Simply exit when the indicator changes color.