
Clives Histogram CCI Indicator
The Clives Histogram CCI Indicator for MT4 is a momentum-based Forex indicator that identifies potential trend reversal zones.
Description
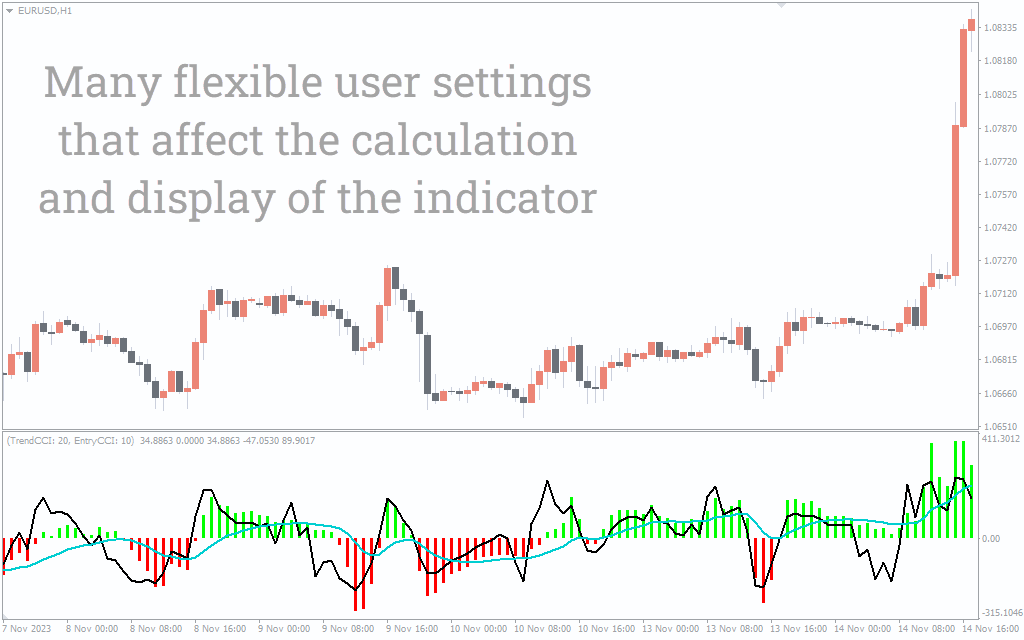
The Clives Histogram CCI (Commodity Channel Index) indicator for MT4 is a custom indicator for trend analysis that displays the CCI value as histogram bars. It oscillates above and below the zero line known as positive and negative zones, measuring the difference between the CCI and the moving average. The histogram value above the zero line indicates a positive zone, while the histogram below is in a negative zone.
The histogram value turns positive when the CCI crosses above the moving average and negative when it falls below the moving average, signaling bullish and bearish momentum, respectively. Furthermore, the Clives Histogram CCI Indicator works on all the time frames, analyzing the market for potential trend reversal.
How to Trade with Clives Histogram CCI Indicator
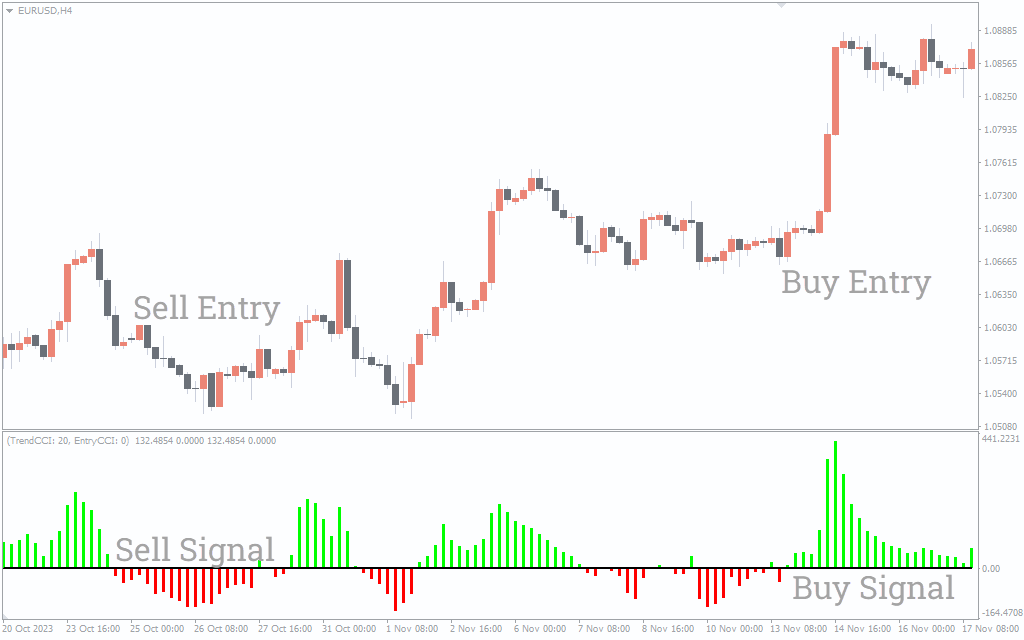
The above EUR/USD chart depicts the trend analysis of Clives Histogram CCI Indicator on the H4 timeframe. The indicator can be used to identify buy and sell signals using two methods – signals generated from crossing the zero line and price divergence.
Buy/Sell Signals Using the Crossing Zero Line:
Forex traders may consider opening a buy trade position when the histogram bars move above the zero line, indicating a potential shift from bearish to bullish momentum for an uptrend.
Similarly, a sell trade may be considered when the histogram bars cross below the zero line, indicating bearish momentum.
Buy/Sell Signals Using Price Divergence:
Finally, the histogram bars can be used to generate buy and sell signals when price action creates bullish or bearish divergence.
Conclusion
The Clives Histogram CCI Indicator for MT4 is an indicator that plots histogram bars that depict bullish or bearish momentum, indicating optimal zones to buy or sell an instrument. Buy and sell trading signals are generated when the histogram moves from the negative to the positive zone and vice versa. Besides, traders may also use bullish/bearish divergence to spot buying or selling opportunities.