
CHO Indicator
CHO Indicator For MT4 provides forex trend reversal signals using the accumulation and distribution line, average price, closing price, and volume.
Description
The CHO indicator for MT4 provides forex trend reversal signals. The CHO – Chaikin Oscillator calculates these signals using the momentum of ADL – Accumulation Distribution Line. However, the ADL is based on the average price, closing price and volume of a candlestick. So, the CHO oscillator is effectively an oscillator of the ADL.
The indicator is easy to interpret and works well for new and advanced forex traders. Moreover, it works on all chart time frames and is suitable for short and long-term trading. However, it may not produce best trading results for scalpers.
CHO Indicator For MT4 Trading Signals
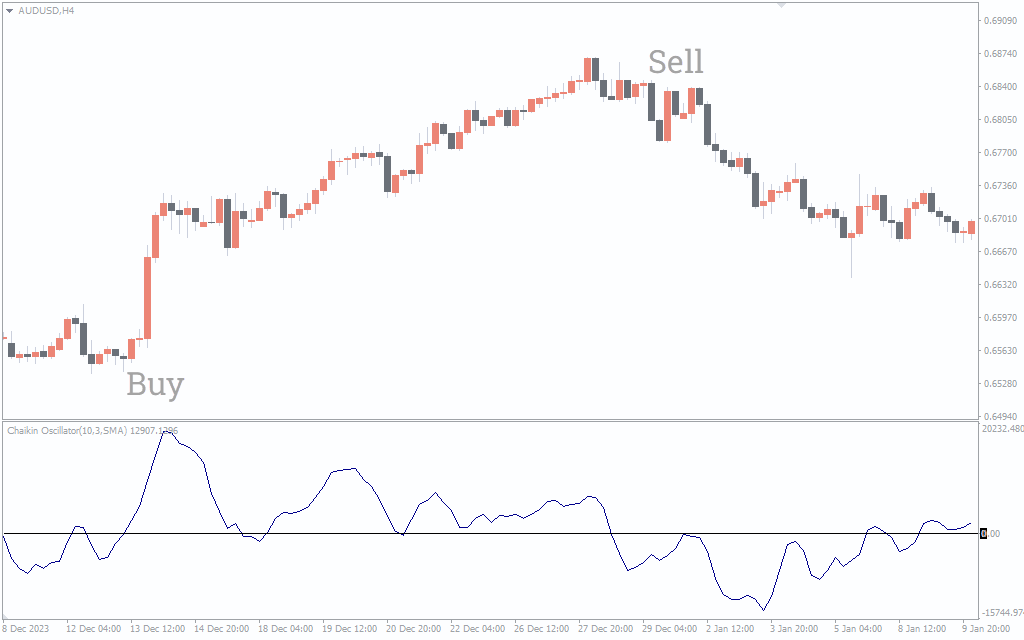
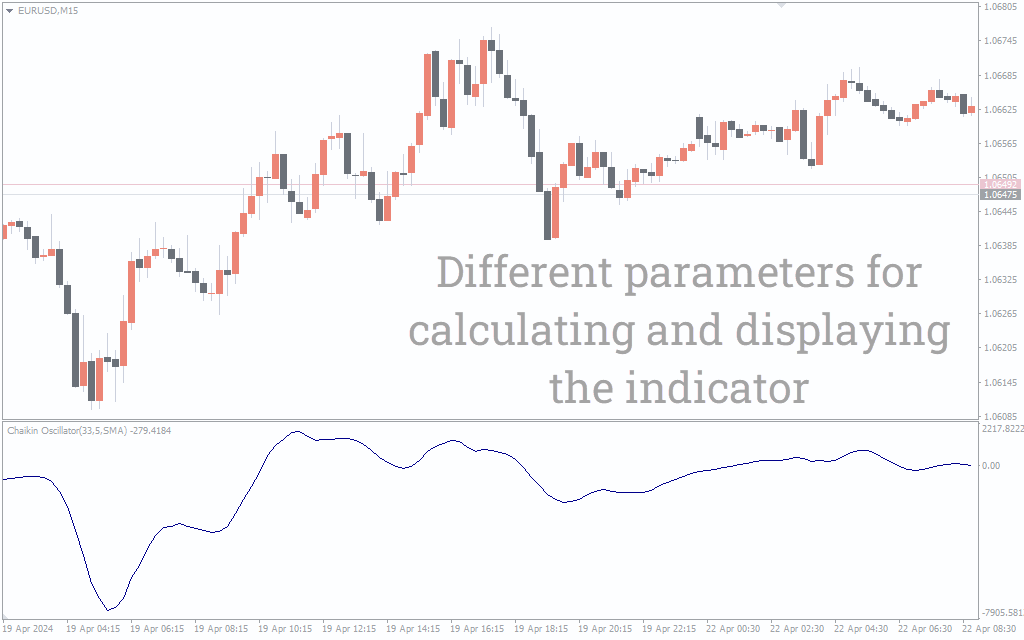
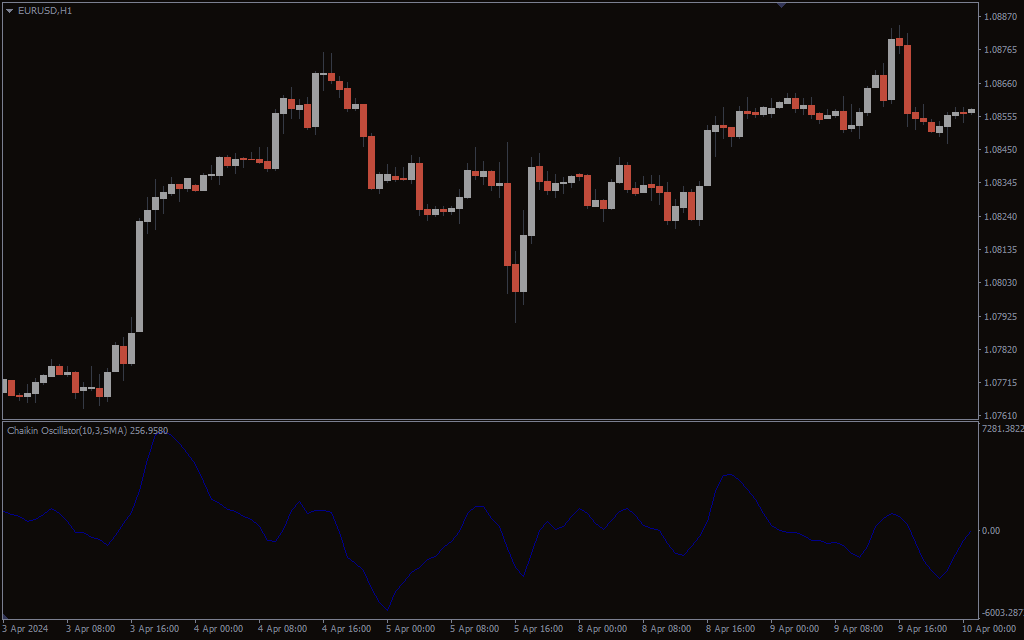
The indicator plots a blue oscillator line in a separate indicator window. Oscillator values above the zero line indicate a bullish trend. Conversely, a bearish trend reversal occurs when the oscillator values move below zero line. So, the best trading strategy is by entering the markets based on the crossover of the zero line and the oscillator line.
Since, oscillators tend to provide best forex reversal trading signals based on convergence and divergence. Another trading strategy is to buy and sell the convergence and divergence between the price and the oscillator line.
The ADL – Accumulation and Distribution line calculates the values using volume as an integral component. Most oscillators do not use volumes; this makes the Chaikin oscillator an excellent candidate in technical analysis. Though ADL calculates volumes, a falling CHO oscillator line indicates a drop in the trading volumes and vice versa. In effect the CHO reflects the accumulation and distribution phases of the market using the ADL values.
Conclusion
In summary, the CHO indicator for MT4 identifies the forex trend reversals using the ADL. However, traders should note that for best results traders should enter the markets in confluence with other technical indicators.