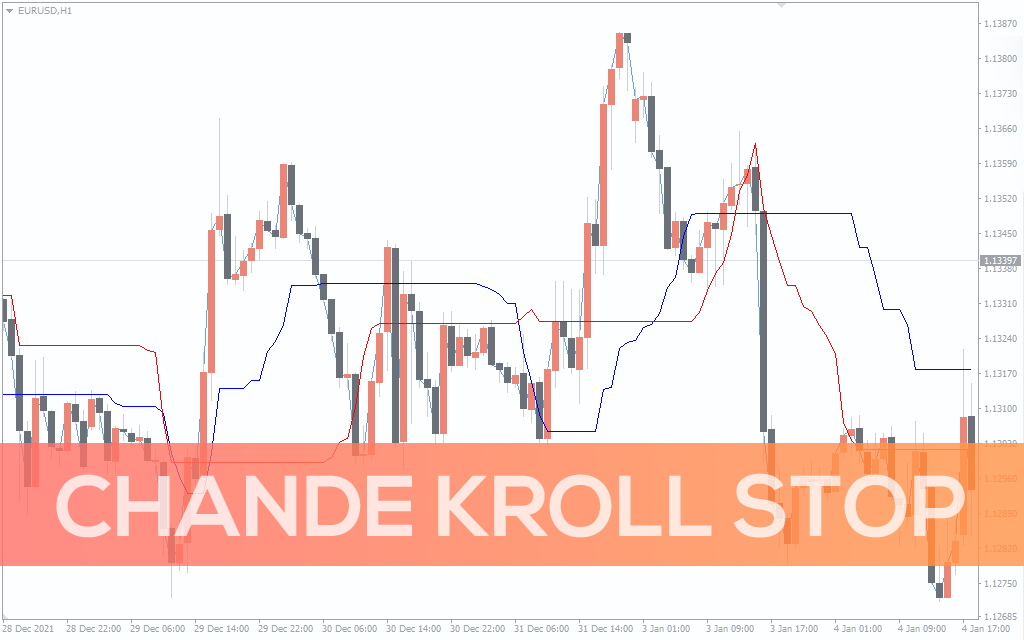
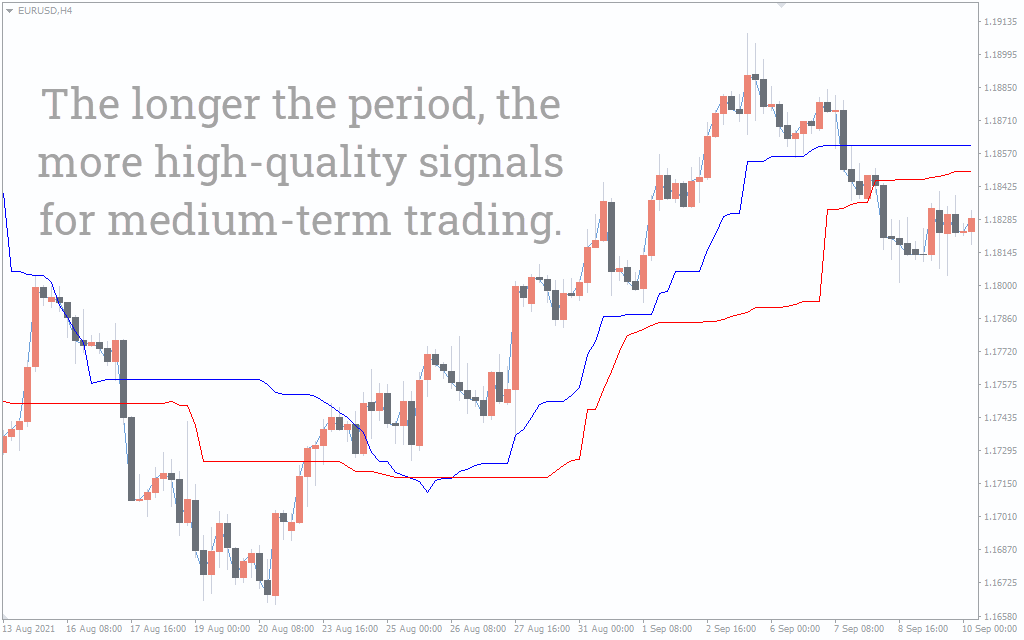
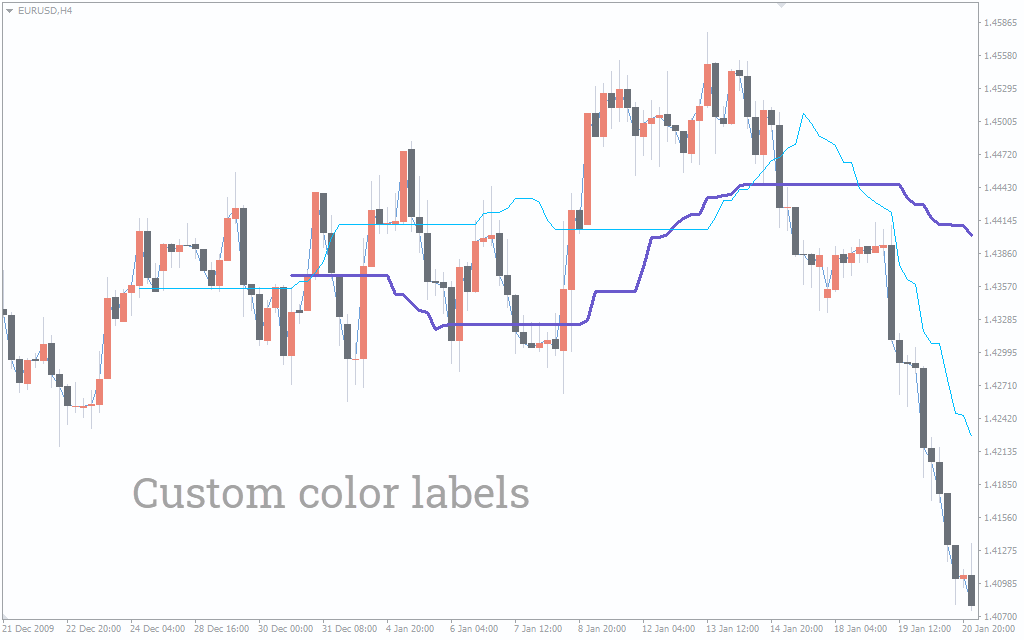
Chande Kroll Stop Indicator
The Chande Kroll stop is an MT4 indicator that helps traders lock in their profits. Additionally, it is an ideal detector for trend reversal.
Description
The Chande Kroll Stop indicator is a unique forex trading tool that helps calculate ideal protective stop loss for a trade. It uses average true range value and a variation of the directional movement. The volatility-based indicator is named after its inventor Tushar Chande and Stanley Kroll. The most interesting feature about the indicator is that it is not affected by volatility. Therefore, trade reversal and volatility do not affect the stop loss.
How Do You Set The Chande Kroll Stop?
Now, how do you use the indicator to set the stop loss? Do not fret. This article gives you a simple guide to using the indicator.
Chande Kroll indicator consists of two lines:
- Blue line or the long stop line
- Red line or the short stop line
Essentially, the indicator lines follow the instrument price. In addition, it tells you the ideal stop loss levels so that you can adjust the trailing stop loss manually.
The indicators suit all traders. This means that you can use it to trade any instrument and in any time frame.
How to Trade
Before delving into buy and sell signals, it is imperative that you understand how the indicator works. For bullish markets, the stop is the highest point of the blue line. The indicator line follows the trend and stagnates when the value drops. The lowest reached by the red line in a bearish market acts as the stop loss. When the price rises, the indicators remain fixed at the same point.
A buy signal occurs when the blue line crosses above the red line from below. This signals an impending uptrend. On the other hand, a sell signal occurs when the red line crosses the blue line from above. The price should be above the trend line during an uptrend and below the trend line during a downtrend.
While the indicator majorly helps protect trade profits, it also shows ideal trade entry and exit points.
Exit Strategy
Close the long positions when the price drops below the blue line. Similarly, for short positions, close the trade when the price jumps above the red line.
Trading Example
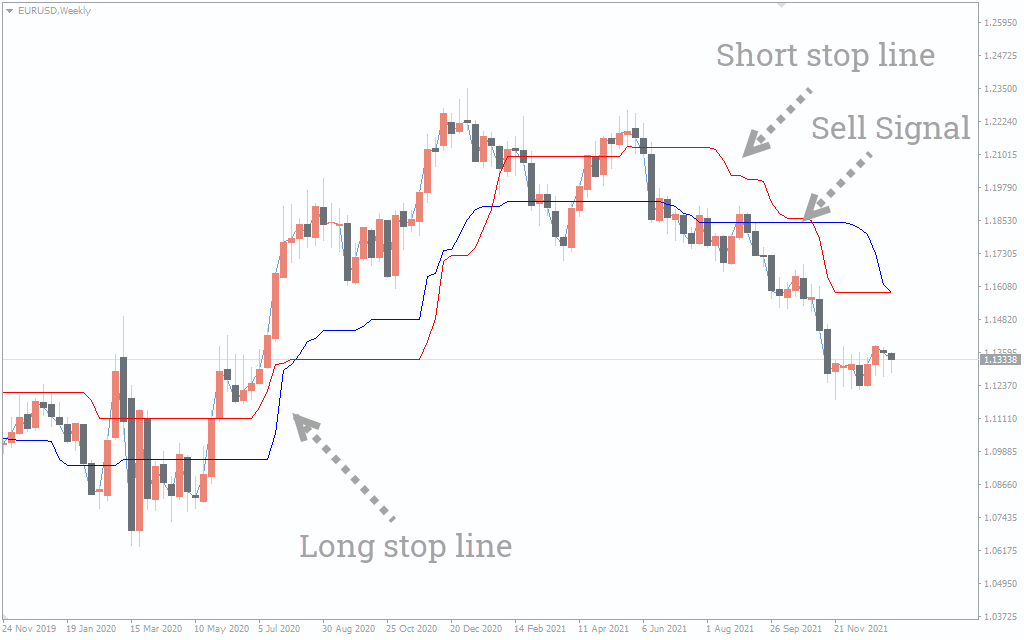
The chart shows price movement for the Euro against the US dollar. The blue line crosses above the red line signifying a buy signal. In fact, the price moves upwards after this signal. The price stays above the blue line which acts as a stop loss.
When the uptrend ends, the indicator line remains stagnant in a flat movement. Eventually, the red line crosses below the blue line indicating an ideal sell signal. The price is trending downwards below the red line which acts as a stop loss. This is a suitable sell signal.
Conclusion
The Chande Kroll stop helps traders protect their trades, especially when in profit. The case of a profitable trade turning into a loss will be a thing of the past. The indicator line acts at the trailing stop loss, with the blue line acting as a long stop during the uptrend and the red line as short stop during a downtrend. It is a beneficial indicator to every trader.