
Best Commodity Channel Index Indicator
CCI is an excellent indicator for detecting price reversal and divergence. Free Download. It provides perfect signal for entry and exit points and when to hold on to a trade.
Description
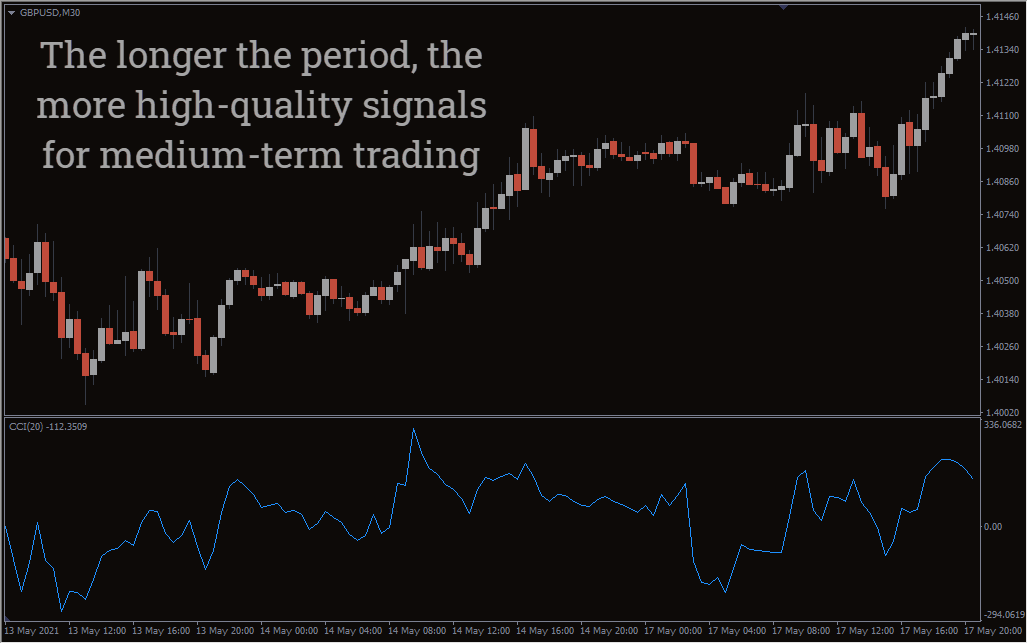
The commodity channel index (CCI) is one of the popular indicators for forex trading. It is used to detect potential trend reversal and divergence between the currency price and its statistical mean price over a period of time. In other words, it shows the weakest and the strongest periods and turning points of the market.
Additionally, the oscillator helps to determine if the asset pair is overbought or oversold. The index value ranges between +100 and -100. If the indicator goes beyond the +100 value, it shows the price is in the overbought area while a -100 is an oversold area.
Overbought means the price has had an unusually long run. Therefore, the sellers are likely to take control of the market as buyers close their winning trades. Here is the point. If the market is overboard, there is a high probability of price correction.
Essentially the indicator is used to find divergence. In other words, when the price reaches a new maximum deviation, it connotes a trend reversal is imminent. Thus, CCI is an excellent indicator for determining whether the current trend is becoming stronger and waning and strategize accordingly.
Commodity channel index indicator for mt4 – download free is a valuable tool for experienced and new forex traders. For beginners, it helps identify ideal entry and exit levels. Seasoned traders, on the other hand, can use the indicator to find divergences.
Remember, the CCI indicator for MT4 is unbound. This means that it has no fixed high or low values. You must therefore be cautious enough when identifying overbought and oversold areas. In most cases, the oversold and overbought zone is set at 100 and -100.
Buy and Sell Signals Commodity Channel Index
The centerline is a neutral or zero level. The area above the 0 line is a buy territory, while the area below the 0 is a selling territory. This means that you should be looking for buy positions. However, when the price enters an overbought and oversold zone, you should expect a price reversal.
To give you a clear picture, the overbought area means a strong uptrend is established. Therefore, you should ready to exit when the reversal pattern or candlestick forms.
Chart Example
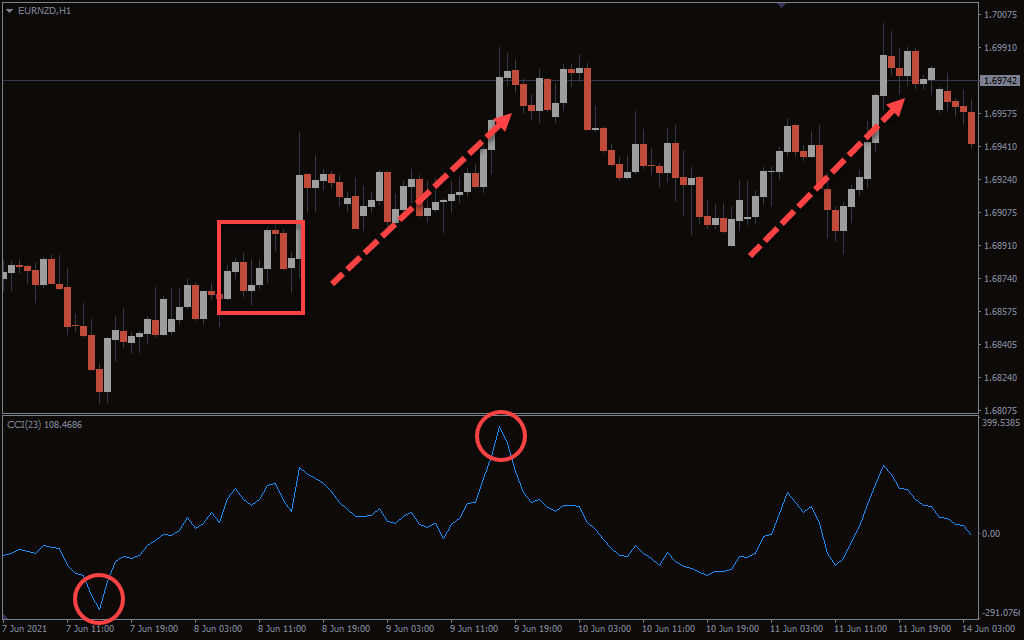
The chart shows a EUR/NZD pair price movement. The red circle points to the area when the price enters the oversold region after a strong downtrend. This is a signal that momentum is dwindling, and the reversal is imminent. The market rebounds in a strong uptrend. Note that the indicator is above the 0 level as the price rises.
The red square shows the price is in the overbought region. But the indicator fails because the price does not rebound. However, the price goes into the overbought area again, as shown by the red arrow signals the market is about to reverse. The price is actually plunging. The market forms a double top pattern which strengthens the signal.
The last red line shows the price in the oversold area. Note the market is in a resistance zone. Therefore, it is likely the price will start a bearish trend.
Conclusion
The commodity channel index indicator is an excellent oscillator for identifying suitable sell and buy positions. Ideally, it tells if you should ride the trend during strong momentum or get ready for trend reversal. Like most indicators, CCI should be used in conjunction with other tools to establish confluence and identify good market entry positions.