

ASC Trend Indicator
Forex market trends from the best ASC Trend indicator for MT5. Find bullish and bearish trends.
Description
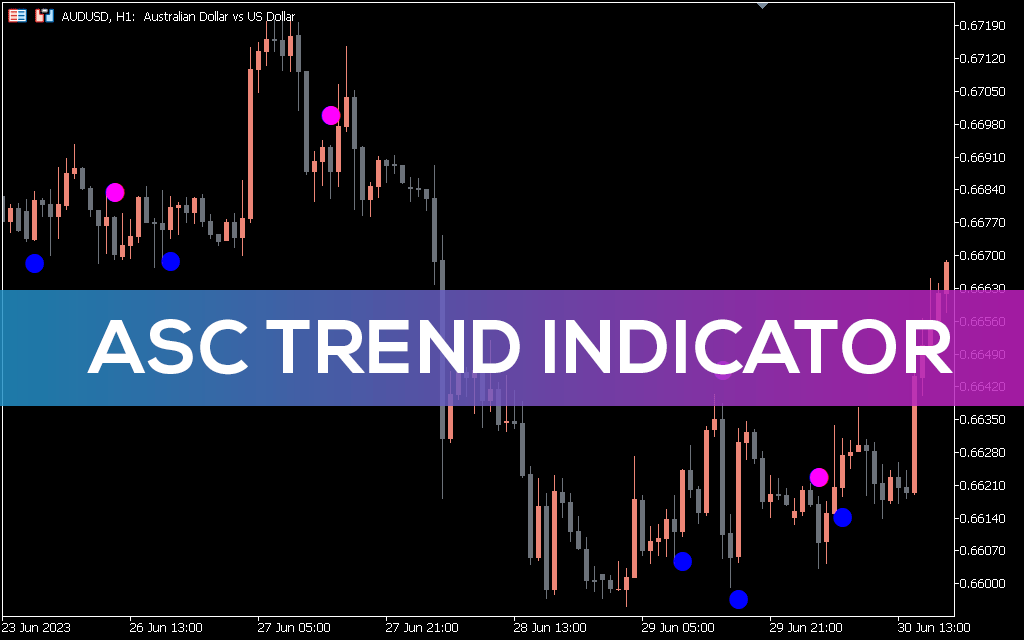
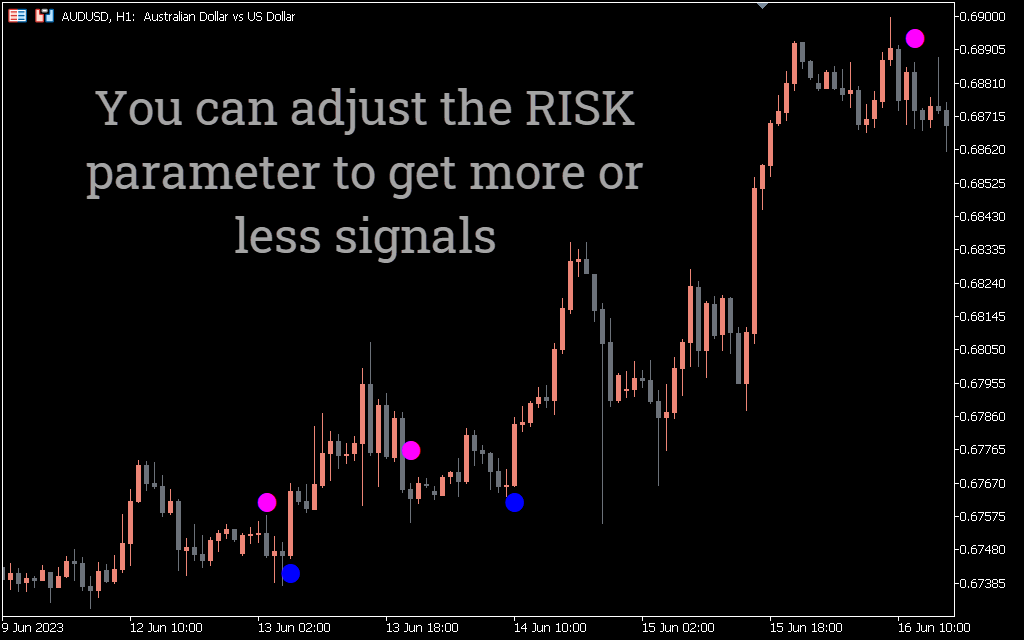
The ASC trend indicator draws trading signals on your chart. The indicator draws bullish and bearish signals in blue and magenta. Blue represents a bullish bar and magenta represents a bearish one.
The indicator works on all timeframes.
However, using the indicator on longer timeframes is better for limiting false signals.
How To Use the ASC Trend Indicator for MT5?
The AUD/USD H1 chart below shows the indicator on the chart.
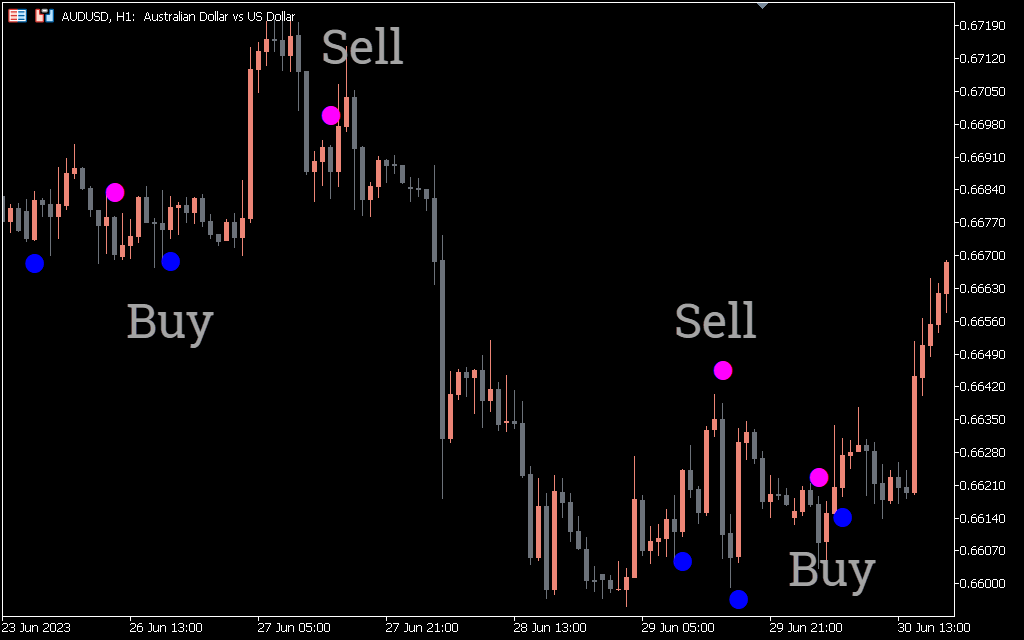
The indicator gives buy/sell signals. While blue and magenta colors help identify bullish and bearish bars, you should also use additional confirmation methods such as candlestick patterns and other indicators.
In some cases, indicative signals, such as magenta on a bullish bar or blue on a bearish bar. This happens when there is not enough volume.
Volume plays a crucial role in confirming the strength and validity of a market trend. With low trading volume, this can lead to less reliable signals and potentially misleading indicator color indications.
In such situations, due to the lack of confirmation of volume, the indicator may not accurately reflect the true bullish or bearish nature of the price bars.
You can use this indicator with other technical analysis tools like support and resistance or indicators like RSI or MACD.
Conclusion
The ASC Trend indicator for MT5 draws small blue and magenta circles. By looking at these bars, you can determine the overall market trend.