Value Charts Indicator
The Value Charts Indicator For MT5 provides a value chart with overbought and oversold signals in the Forex market.
Description
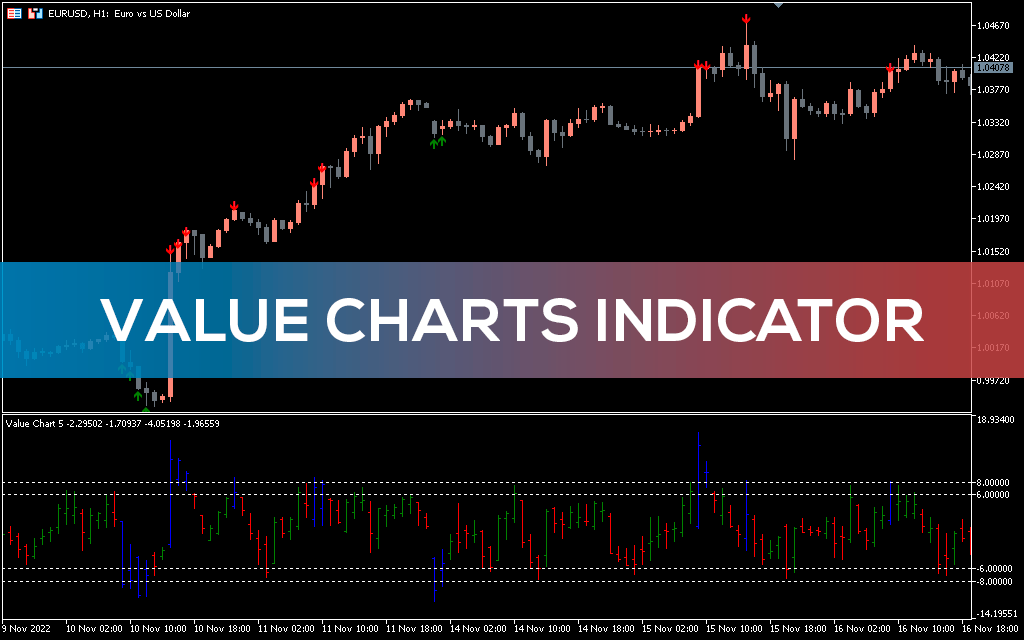
The Value Charts indicator for MT5 builds an additional value chart as a separate indicator window. The indicator plots green and red candles, as well as oversold and overbought levels. Thus, forex traders can anticipate a price reversal if the price chart reaches oversold or overbought levels.
As a result, traders will be able to identify the best entry points and buy and sell accordingly.
The indicator works well for beginners and experienced forex traders. However, novice traders should understand oversold and overbought trading strategies and apply price action to confirm trading signals. While advanced forex traders can use the indicator in combination with other indicators and apply them in complex trading strategies.
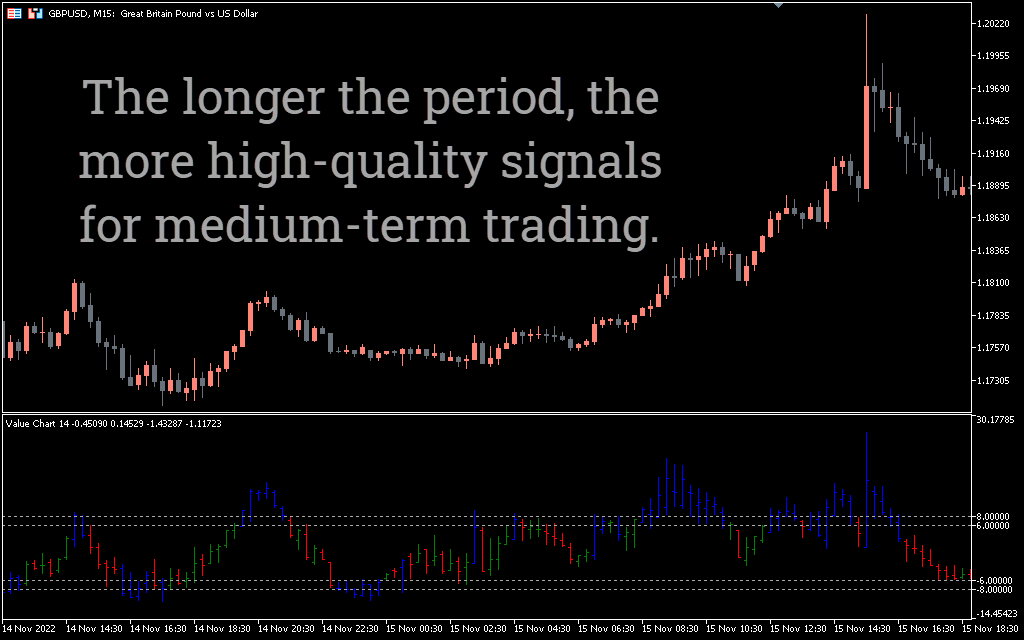
The indicator works well on all intraday price charts as well as daily, weekly and monthly charts. In addition, forex traders can download the indicator for free and install it easily.
Value Charts Indicator For MT5 Trading Signals
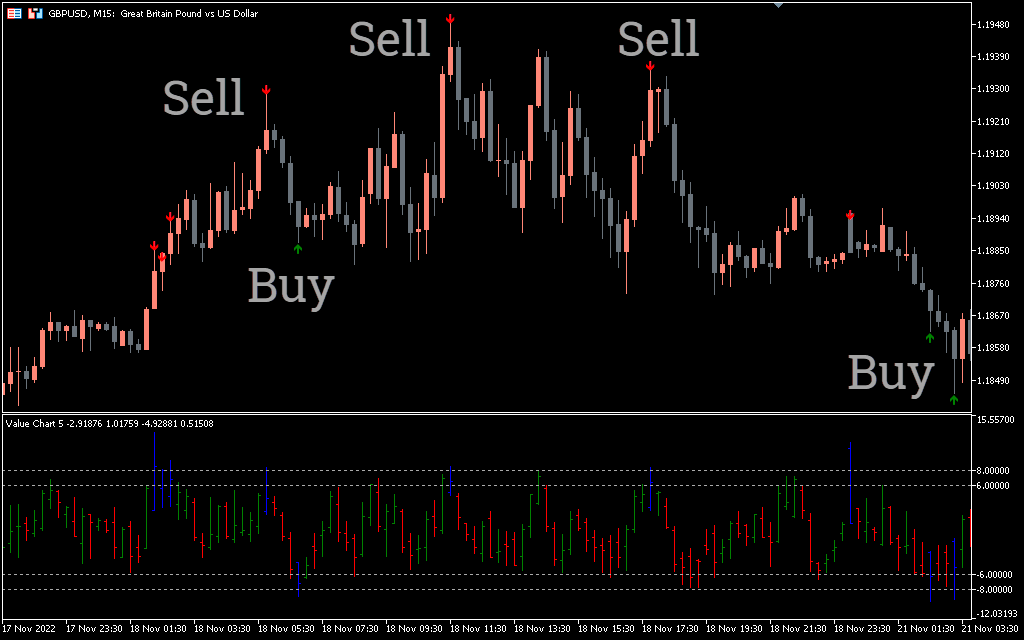
The above GBPUSD H1 candlestick chart shows the Value Charts indicator for MT5 in action. The indicator displays bearish candles in red and bullish candles in green. Also, the overbought level is on the green line and the oversold level is on the red line.
The indicator also draws green and red arrows of trading signals on the price chart.
If the candles on the price chart reach the green oversold line, this indicates a potential trend reversal. Thus, forex traders can enter the market with a buy and place a stop loss below the previous swing low.
Similarly, as soon as the candles on the price chart touch the overbought line, traders can anticipate a bearish trend. Thus, traders can place a sell trade with a stop loss above the previous swing high. The indicator does not give a profit target. Thus, traders should take profits with a good risk-reward ratio.
Because the indicator only shows overbought and oversold levels and anticipates a trend reversal. Thus, for best results, traders should confirm entry points using price action or any other indicators. In fact, the indicator works best as part of a trading strategy and should not be used on its own.
Conclusion
The Value Charts indicator for MT5 is an oscillator with overbought and oversold levels. While forex traders can use overbought and oversold levels and trade similarly to other technical indicators, signals must be confirmed with price action or other indicators. Plus, it’s free to download and install.