

StochRSI Indicator
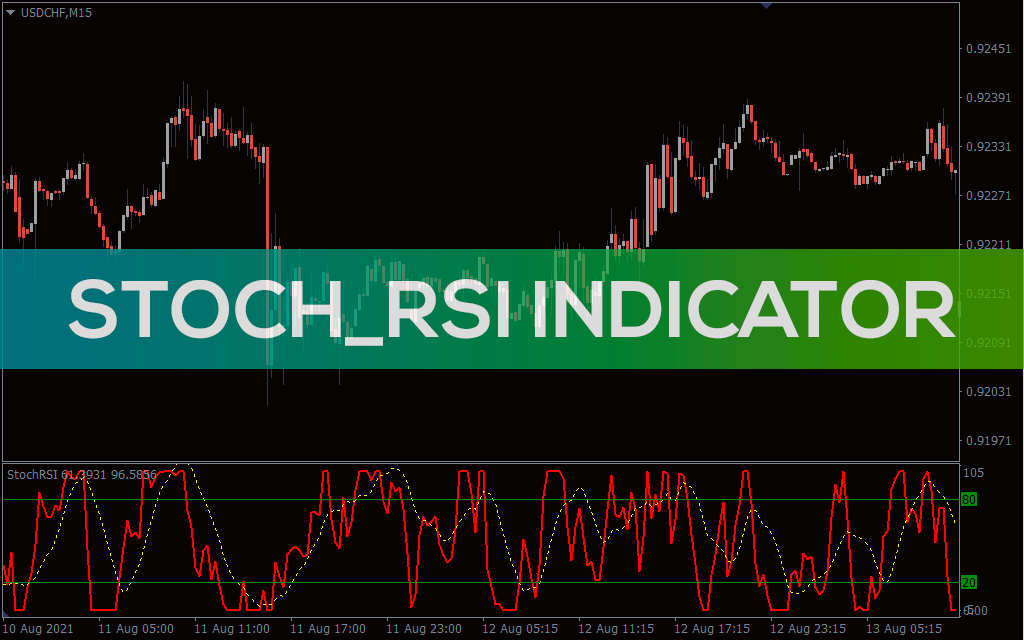
StochRSI is a classic forex trading indicator that offers the best trend trading signals in MT4. Anticipates precise buy/sell zones & trade exit positions
Description
The StochRSI represents a combination of Stochastic Oscillator and Relative Strength Index(RSI) that brings a new dimension to technical analysis.
Applying the RSI value over the Stochastic formula allows this indicator to determine trend directions and overbought/oversold conditions. Besides, the StochRSI is more reactive than the individual Stochastic and RSI indicators. As a result, it remains more volatile in live markets, offering real-time signals during precise market conditions.
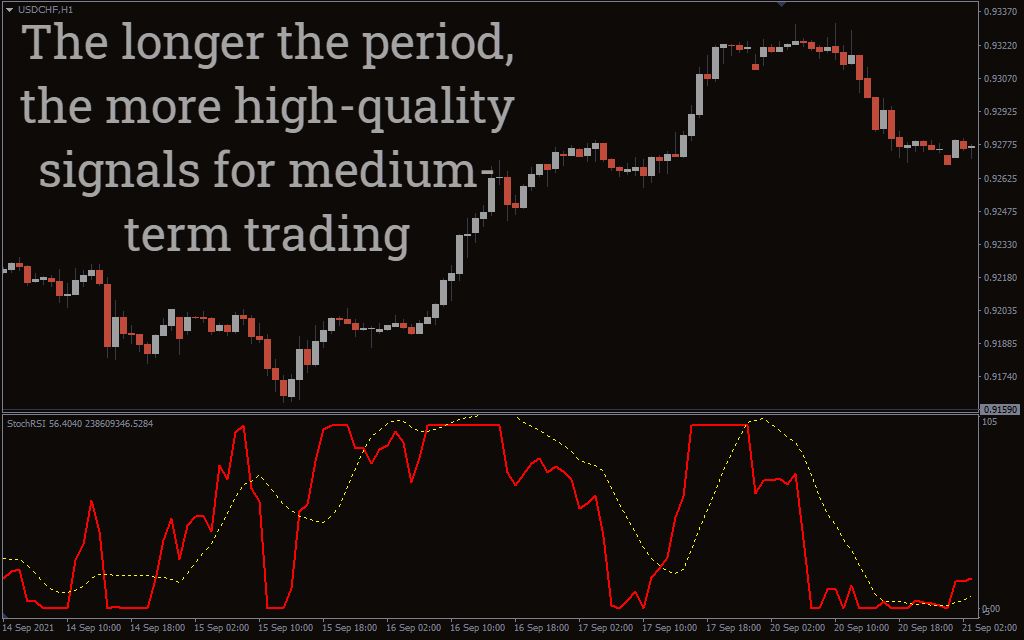
The reason behind increasing the sensitivity of the indicator is to make it more suitable for short-term trading. Both Stochastics and RSI work on all timeframes, but they lag while anticipating scalping and day trading signals. But it shows completely different results after merging them as a single technical tool.
Stochastics is the main base of this MT4 indicator. The formula also remains almost the same. The developer has created a room to place the RSI value within the Stochastics formula. You’ll find the %K and %D lines at the indicator window like the original Stochastic Oscillator. These lines move within 0 and 100 levels to point the OB/OS market status.
How to use StochRSI for determining profitable forex trading signals in MT4
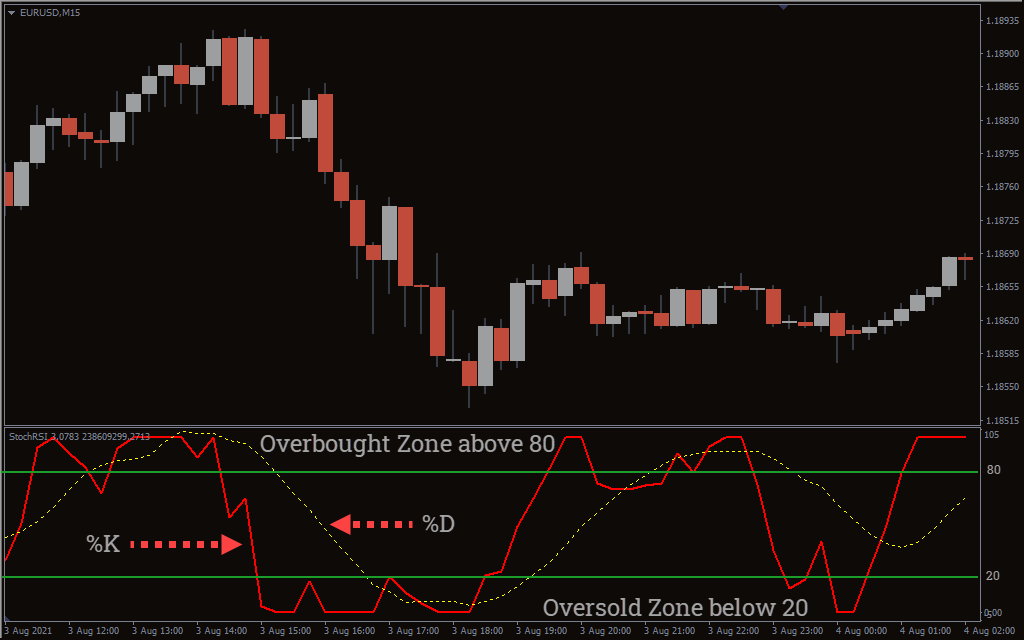
The StochRSI is well-known for its simple demonstration of buy-sell signals. The %K line above 80 suggests an overbought market. Contrarily, the value drops below 20 to confirm an oversold condition. The %D is a moving average of %K. We’ll use it to validate the overbought/oversold signals determined by %K.
Look for buy opportunities when the Stoch RSI signals an oversold market. In an oversold situation, the %K moving above %D provides an early hint of a bullish price reversal. In such a condition, we can confirm a buy order after the indicator value rises above 20. The indicator line returning downwards after hitting the overbought zone signals a buy exit.
Conversely, the StochRSI value turning above 80 indicates the market is in an overbought condition. While the %K moving below %D in the overbought market suggests an end of the current bullish trend. The signal line returns below 80 after making a bearish crossover with %D means a sell confirmation. Consider a sell-exit when the %K rebounds from the oversold zone.
Conclusion
The StochRSI offers a super solution for forex scalpers and intraday traders. Its classic demonstration of trend and OB/OS signals are effortless to read and follow. Since this indicator is highly sensitive to price-action changes, it may deliver mixed or average winning signals during sidelined market conditions. According to our review, StochRSI works better in highly volatile market situations.