

SMMA Wilders DMI Indicator
SMMA Wilders DMI is an ideal indicator for determining the direction of a trend. The perfect volatility and price strength detector for bull and bear markets.
Description
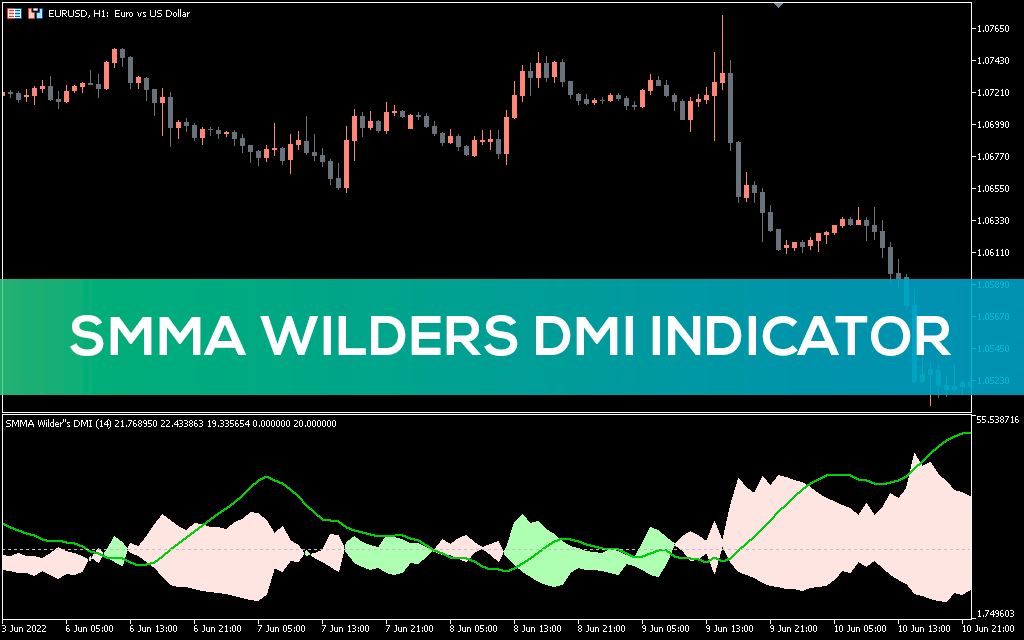
The SMMA Wilders DMI indicator for MT5 measures the strength of a trend. As the name suggests, it also shows the direction of price movement. The indicator consists of two +DI and -DI lines, a colored space between them, as well as separate ADX and ADXR lines in the window below the price pattern.
The Plus Direction Indicator (+DI) shows price momentum is rising, while the Minus Direction Indicator (-DI) shows price momentum is falling. The lines and behavior of the histogram will tell you whether to open a buy or sell signal. In fact, the ADX goes one step further to show price volatility, giving you more reason to enter or exit a trade.
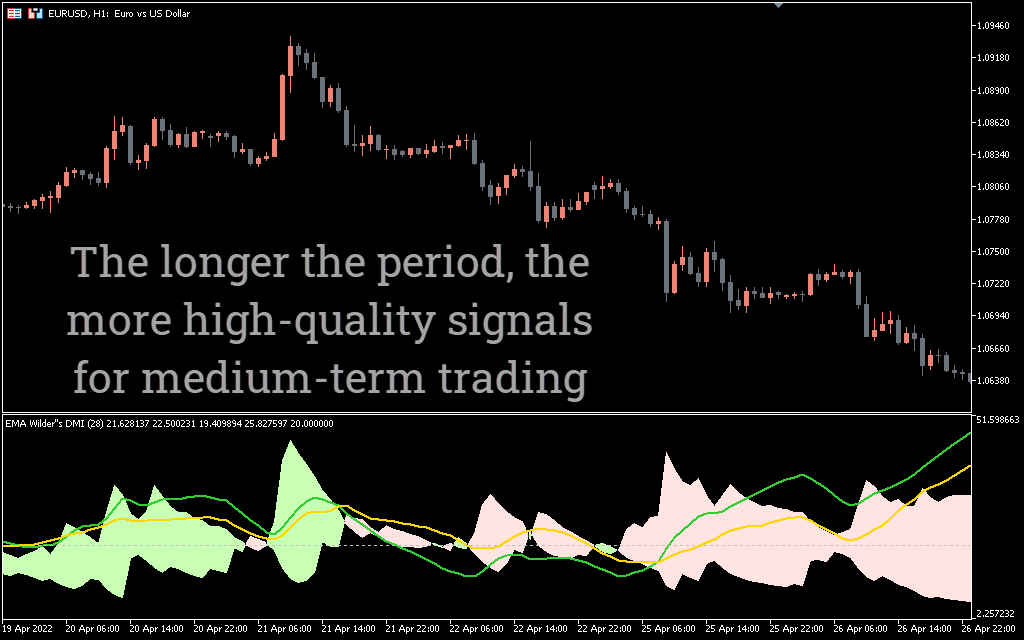
The indicator is ideal for both long-term and short-term trades, novice and experienced traders. You can also use the oscillator on any time frame.
SMMA Wilders DMI BUY / SELL Signals
As a trader, you will want to enter when the trend is strong. So how does the indicator display a strong trend? Just check ADX. When the ADX line is above 20, it indicates an extremely strong trend.
Now the next step is to decide whether to go long or short.
Buy signal
Open a long position when the indicator turns light green. Therefore, a strong buy signal occurs when ADX is above the level of 20, and the green zone is expanding. In addition, you can turn off the ADXR line to confirm the signal.
Sell signal
Open a short position when the zone turns pink. A strong sell signal occurs when the histograms are above level 20, and the pink zone is as wide as possible.
You will want to exit when the two lines cross because this is a clear sign of a change in market trend.
Real market example
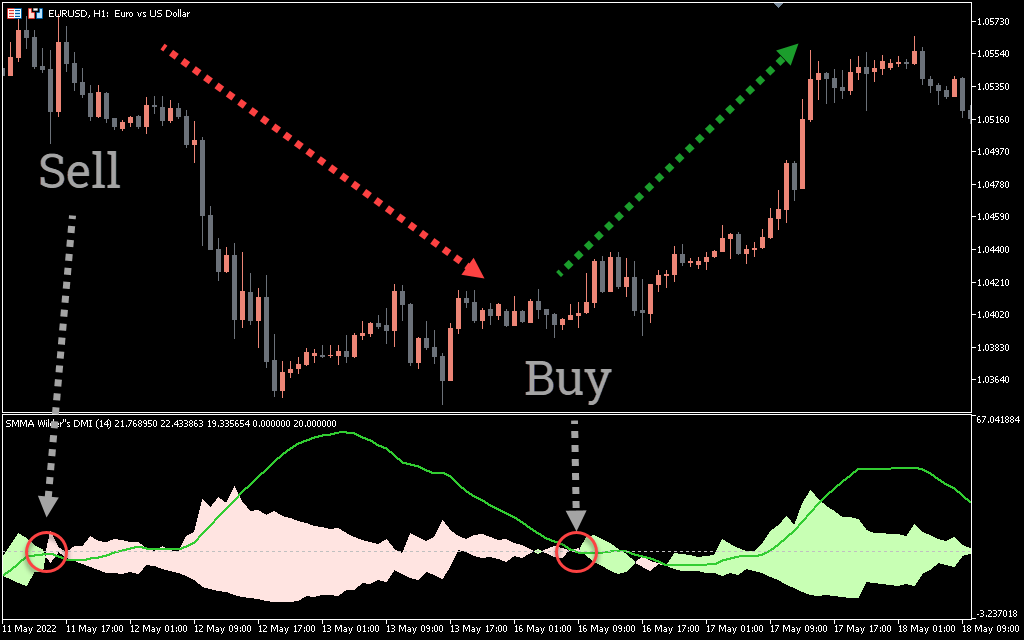
The above chart shows the price movement of the EUR against the USD on an hourly chart. After the intersection of the +Di and -Di lines, we see a pink area, which indicates that the currency pair is in a downtrend. A green ADX line above level 20 indicates a strong trend. These are all clear signs of an ideal selling position. As you can see from the chart, the price has been in a strong bearish move since the crossover, as indicated by the arrow.
Ideally, you should close the position when the indicator changes color at the beginning of a downtrend. This means that you should exit the trade or prepare for a long trade.
Conclusions
SMMA Wilders DMI is a great tool for determining the direction and strength of a price trend. Depending on the position of the indicator lines and the ADX, a trader can determine whether to go long or short. You should aim to open trades when the ADX line is above level 20.