

RSI Candles MTF Indicator
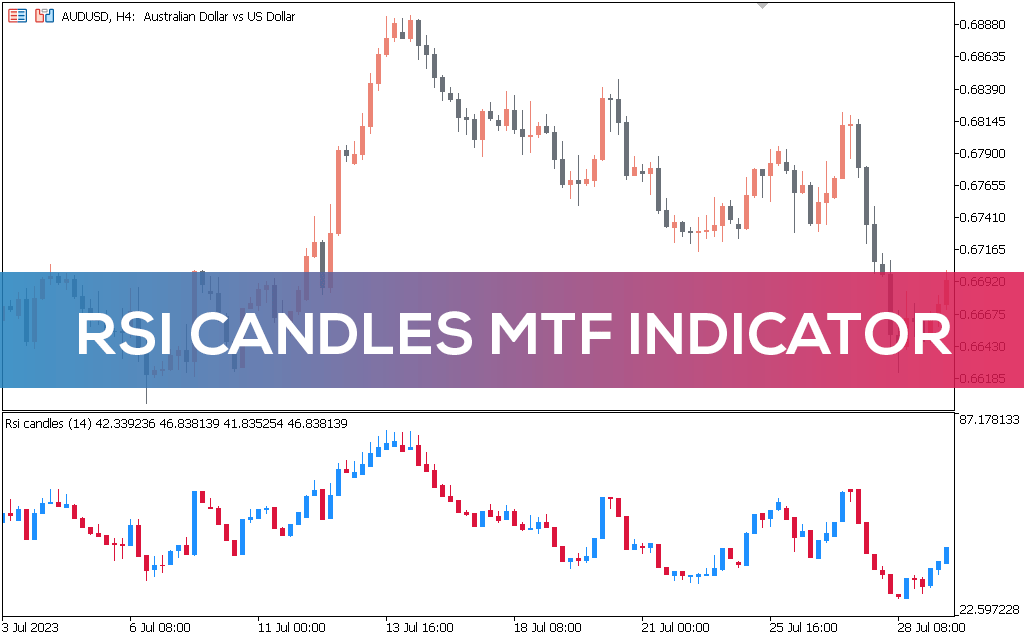
The RSI Candles MTF indicator for MT5 displays the value of relative strength on candles.
Description
The RSI (Relative Strength Indicator) Candles MTF indicator for MetaTrader 5 is a technical system that automatically displays the value of the relative strength indicator directly on the candles of a financial asset.
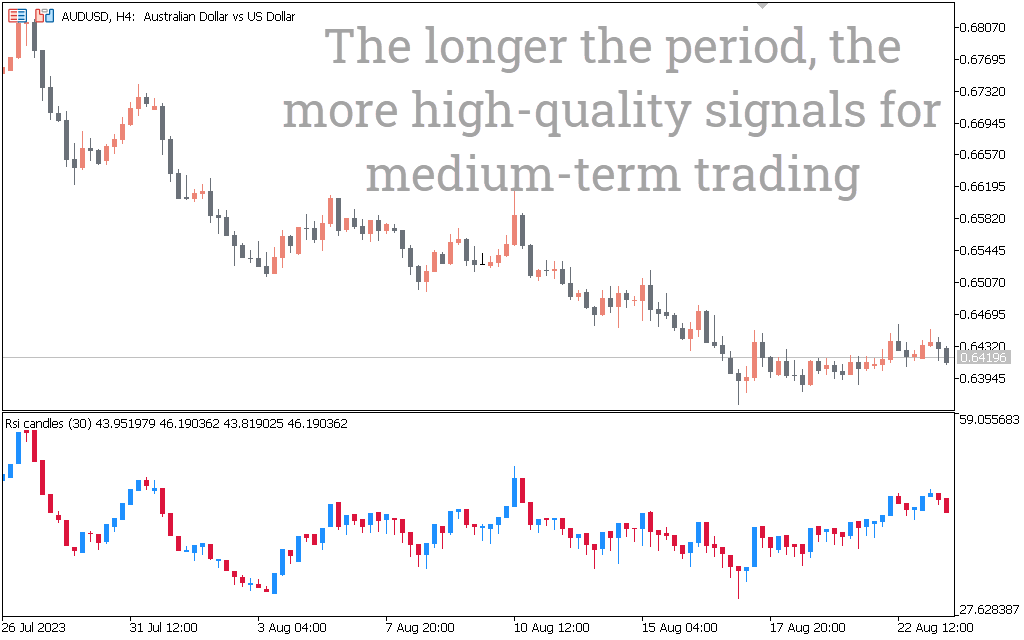
The indicator is simply an optimized system for quickly identifying overbought and oversold price zones on multiple timeframes.
Plus, it will also help make your chart less cluttered, giving you plenty of room for technical analysis.
How to Trade with the RSI Candles MTF Indicator for MT5
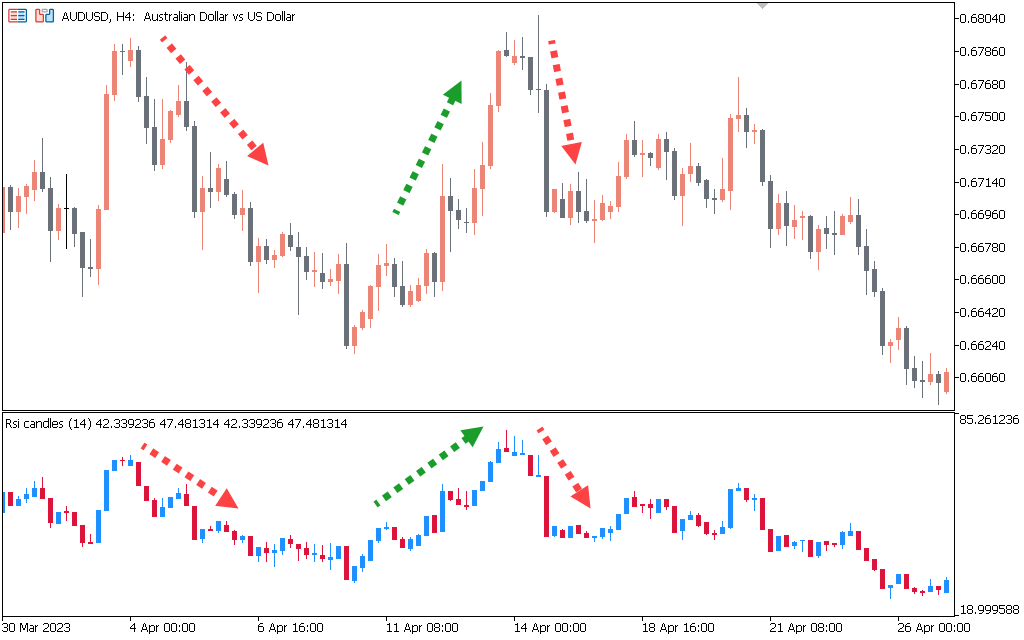
The image above shows the action of the RSI Candles MTF indicator on the AUDUSD pair. The indicator paints the candle blue when the RSI rises above the 50 level, suggesting a possible bullish move. Conversely, the candle turns red when the RSI value falls below the 50 level, indicating a potential bearish trend.
In addition, it is important to note that the blue and red bars displayed by the indicator on candlesticks are not signals to trade to buy or sell. However, you can use this information in conjunction with price action/other indicators to determine if a market is buying or selling. For example, you might enter a sell position when the price action forms a bearish engulfing candle when the price is below 50 RSI levels.
Conclusion
The RSI Candles MTF Indicator for MT5 is simply an RSI indicator that has been designed to be displayed on candlesticks in the financial market. In addition, the indicator can be downloaded for free.