

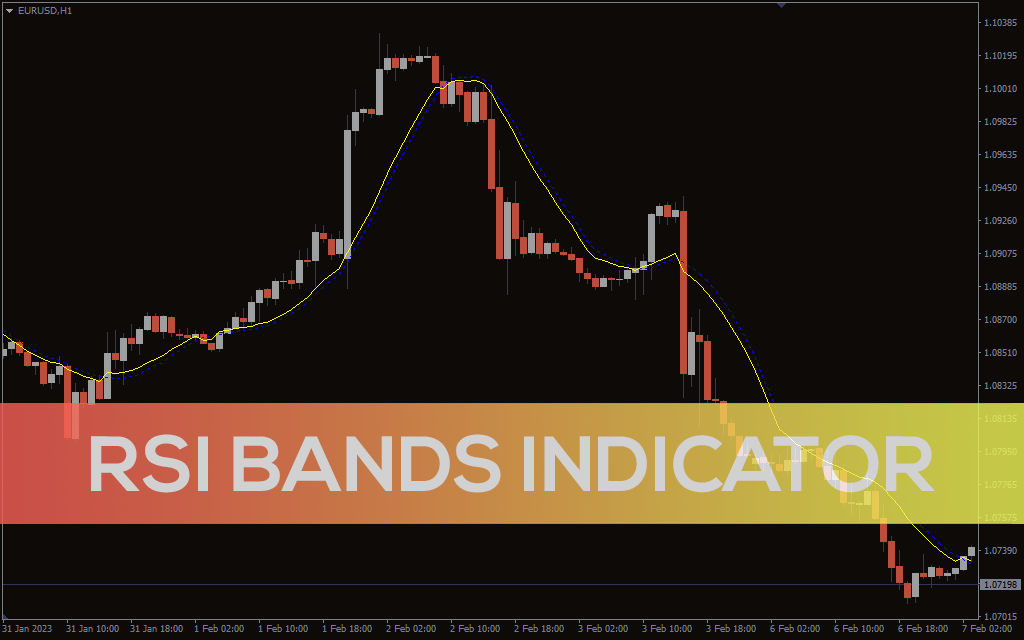
RSI Bands Indicator
he RSI Bands indicator for MT4 is a custom trading tool that detects overbought/oversold zones of the price and also generates a buy/sell entry.
Description
The RSI (Relative Strength Indicator) Bands indicator for MetaTrader 4 is a custom trading tool that detects overbought/oversold zones of the price and also generates a buy/sell entry. This is in contrast to the regular RSI that comes with the MT4 platforms which detect overbought/oversold zones only.
How do you read an RSI band?
The traditional RSI indicator signals a potential overbought asset when the price trends to level-70 or above, while an oversold asset is depicted when the price trend to level-30 or below.
However, this technical indicator (RSI Bands) is unique because it was built with blue and yellow lines that run through the main chart. The two lines oscillate along with the price movement to detect an overbought/oversold limit.
Furthermore, the indicator depicts a potential overbought/oversold asset when the yellow line crosses the blue dotted line to the downside/upside, respectively. What’s more, the crossover between the lines signals a buy/sell entry after the price also closes below the lines. Nonetheless, the indicator is recommended to be used along with price action/ or other technical indicators for better efficiency.
How to Trade With the RSI Bands Indicator
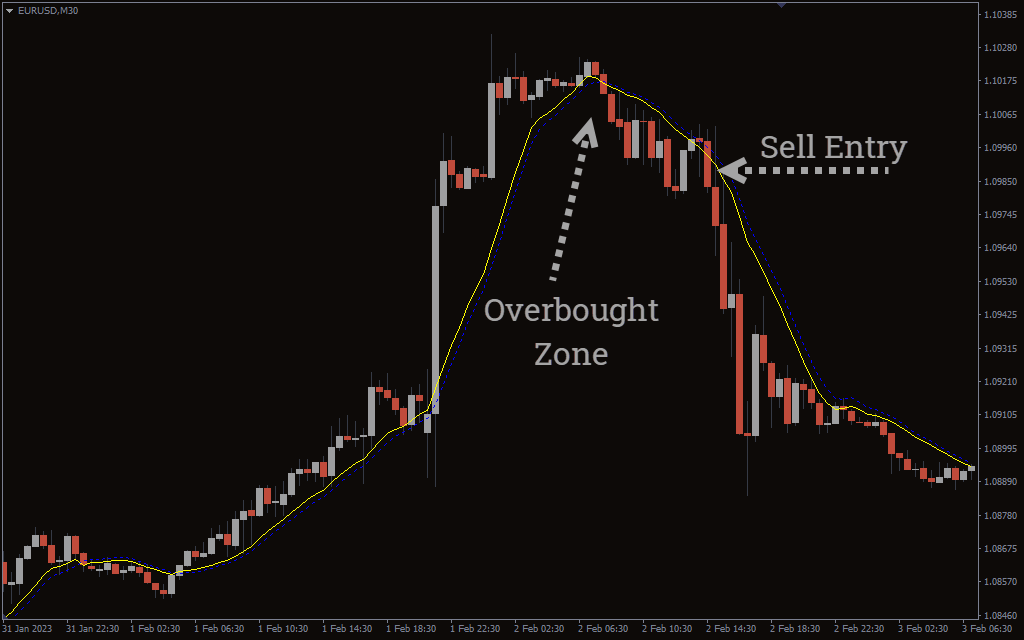
The above image depicts the action of the indicator on a EURUSD currency pair in the M30 timeframe. It illustrates how to use the indicator in synergy with price action.
Firstly, the image shows that the indicator’s lines crossed over each other, which depicts that the price had gotten to a potential overbought zone. Besides, the price also closed below the lines after the crossover, which further suggests a possible trend reversal.
Furthermore, the price created a supply zone and retested it, which also indicates a possible bearish move. Finally, the sell entry was confirmed after the bearish candlestick that closed below the supply zone.
Conclusion
The RSI Bands indicator for MT4 is a dynamic forex trading tool that identifies extreme trend conditions in the financial market. Moreover, it is suited for scalpers, day/intraday, and swing traders in making technical analyses. Finally, it is free to download.