

RBR-DBD Indicator
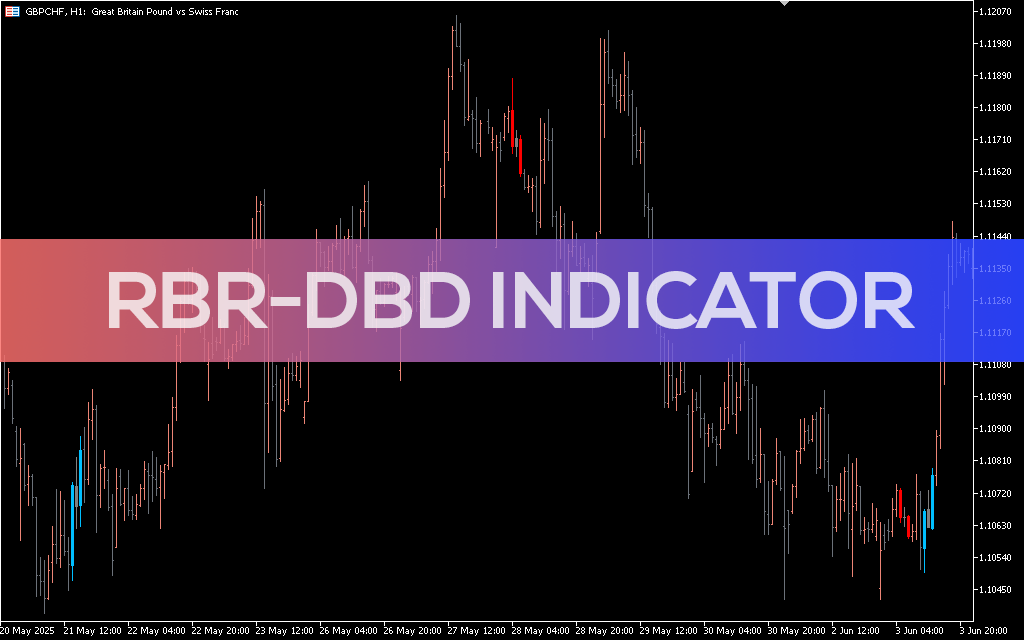
Spot institutional supply and demand zones with the RBR-DBD MT5 Indicator. Ideal for smart money and price action strategies.
Description
The RBR-DBD Indicator for MetaTrader 5 is a specialized tool that identifies Rally-Base-Rally (RBR) and Drop-Base-Drop (DBD) patterns on the chart. These formations are crucial components of supply and demand trading and are commonly used to locate high-probability reversal or continuation zones. The indicator analyzes recent price action and volatility to automatically highlight areas where strong impulsive moves originate from a consolidation base, giving traders an edge in anticipating institutional order flow.
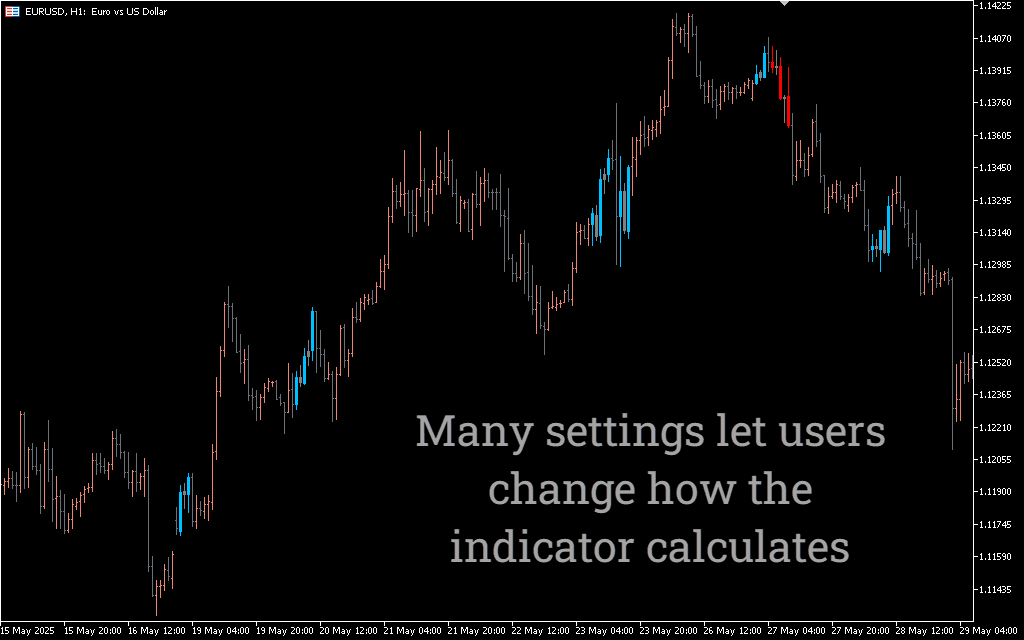
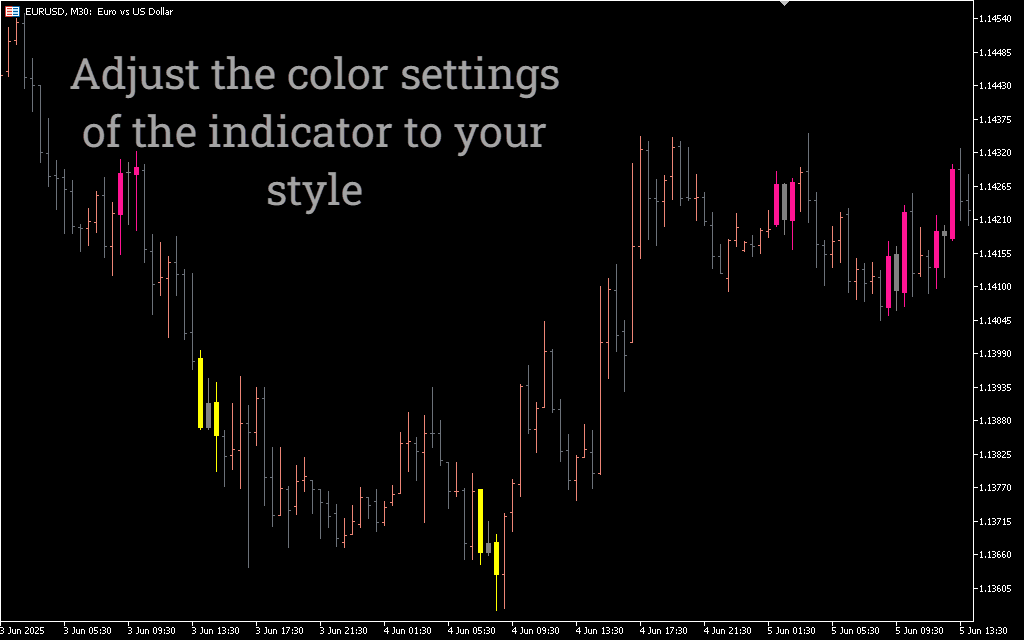
This tool is ideal for those trading smart money concepts, price action strategies, or simply seeking a visual method to recognize the formation of key demand and supply levels. By focusing on the size of the move and the base structure, the RBR-DBD Indicator visually marks the critical candles using distinctive color highlights, making it easier to analyze market intent.
RBR-DBD Indicator Trading Signals
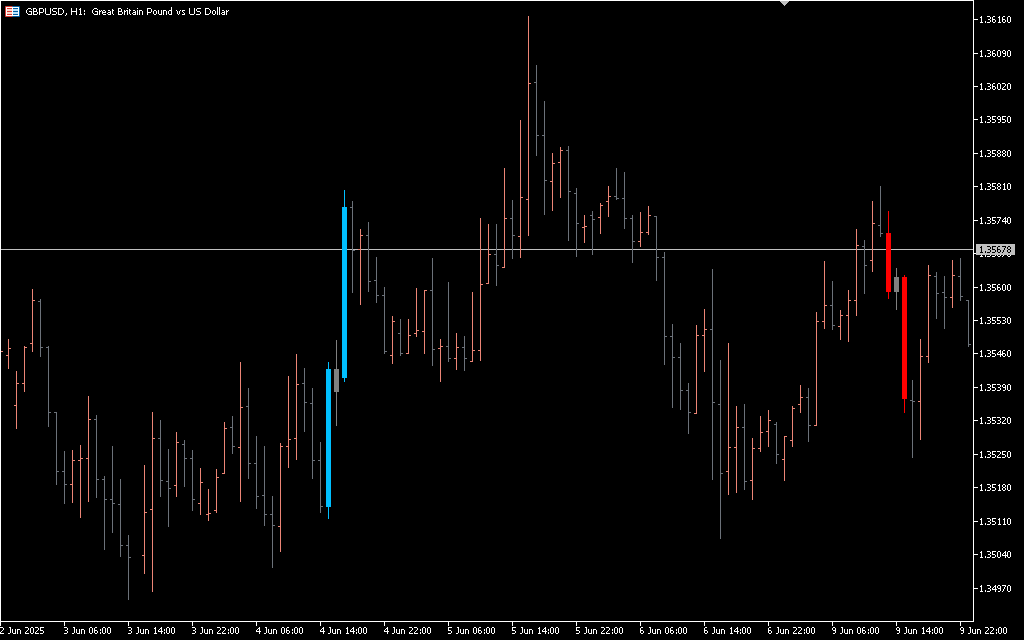
The RBR-DBD Indicator does not generate classic buy or sell signals, but rather highlights price zones of institutional intent—areas where price has paused before launching into a strong continuation. A blue-highlighted base indicates a Rally-Base-Rally pattern, suggesting a demand zone where buyers accumulated before a sharp move up. A red-highlighted base marks a Drop-Base-Drop formation, pointing to a supply zone where sellers stepped in before a downward continuation. Traders use these highlighted zones to look for price to return to the base and react, often resulting in a bounce or rejection. When combined with market structure analysis, these zones serve as actionable entries, rejections, or stop loss buffers depending on the context.
Conclusion
The RBR-DBD Indicator for MT5 is a valuable resource for traders looking to integrate supply and demand theory into their charting. By highlighting key base formations from which impulsive moves originate, the indicator provides a visual map of where institutions may have entered the market. Whether you’re entering trades based on price returning to these zones or using them as confluence in your broader strategy, this tool allows for a more confident, structured approach to technical trading.