

Price Channel Indicator
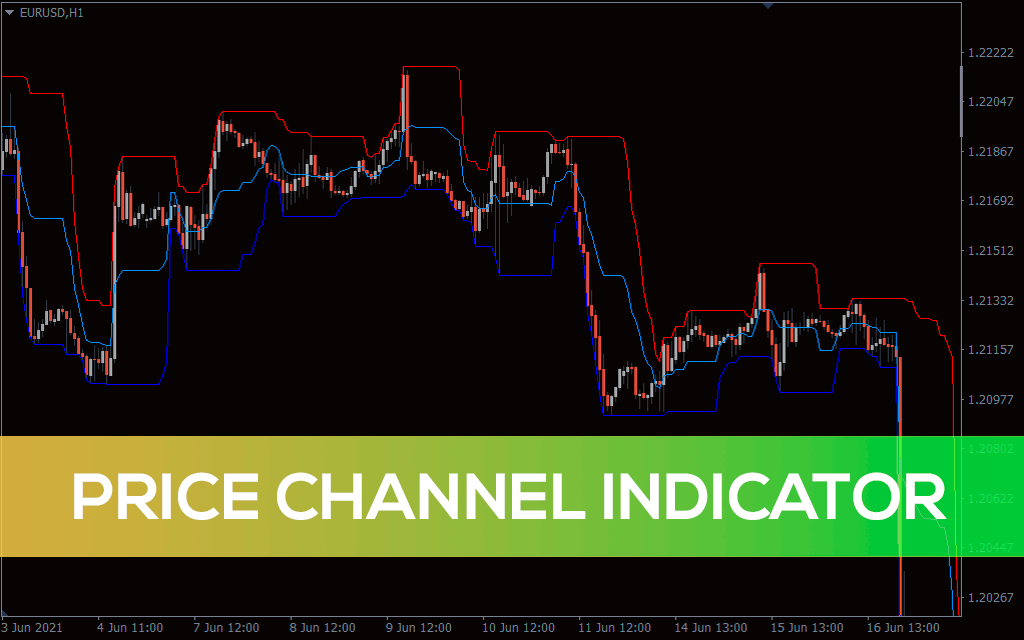
Price Channel Indicator for MT4. Identify upper and lower price channels. Free Download. Accurate buy/sell signals. Find breakouts.
Description
A Price Channel indicator helps to determine an asset’s price oscillations between three parallel lines, either horizontal, ascending, or descending.
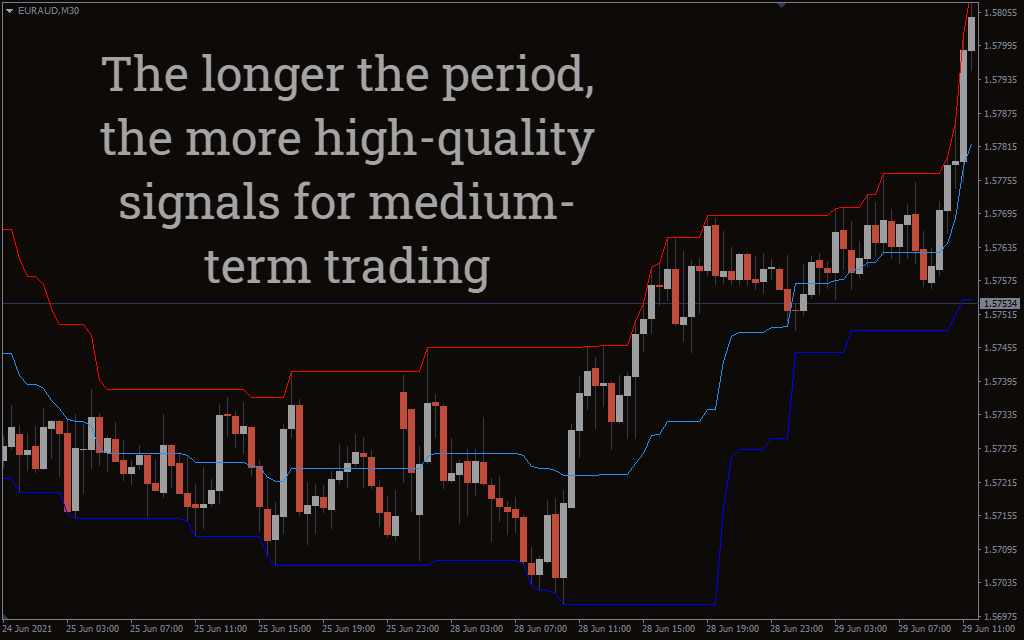
The indicator is quite useful in identifying breakouts, which is when a currency pair’s price breaches either the upper or lower channel.
In this guide, we’ll talk about all the nuances and peculiarities of the indicator.
What is a Price Channel indicator?
Indicator suggest possible signals based on price breakouts. These consists of the Upper-PriceChannel, Lower-PriceChannel.
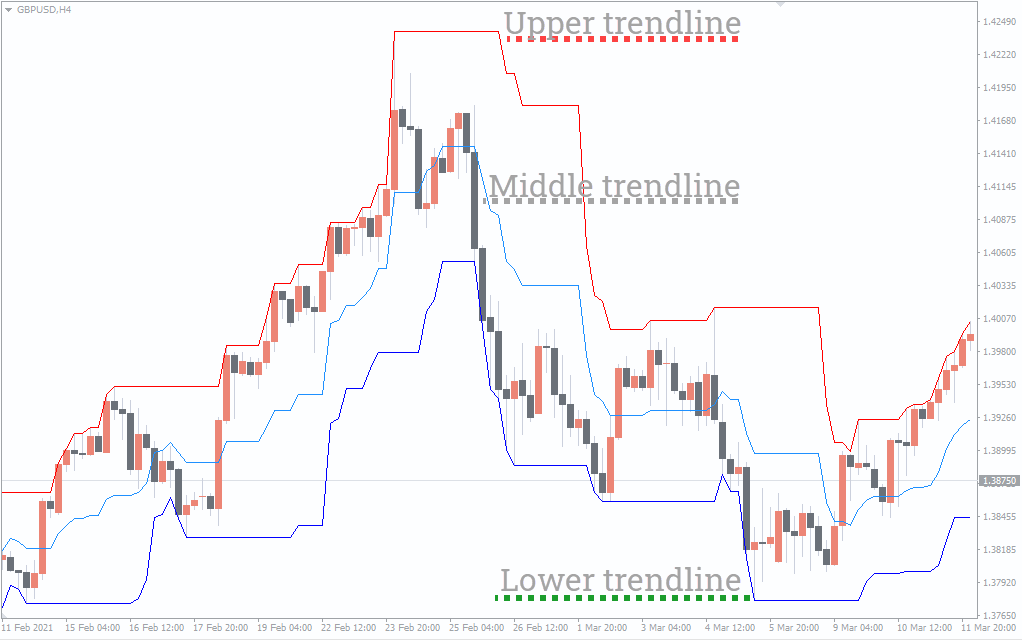
The highest high over a defined period represents an Upper Price Channel, and the lowest low over a set period is a Lower Price Channel.
The period for these channels is 14.
The indicator is calculated by taking the highest high or lowest low over a certain price range.
There’s also a middle trendline, which serves as a balancing act between the upper and lower channels.
Unlike indicators like Bollinger Bands or Average True Range, the indicator is based on the difference between the Lowest Low and Highest High, and as a result, it is connected with probable regions of support or resistance. Price Channels, like Bollinger Bands and Average True Range, tend to narrow during times of sideways movement and price consolidation, generally before a breakout.
As a result, the indicator can serve two functions:
- Identifying probable support and resistance levels for channel trading methods
- Spotting price breakouts when the price closes above or below the Upper or Lower Price Channel.
How to use the indicator?
When the price pivots higher, the indicator’s lower trendline is drawn. Conversely, when the price pivots lower, the upper trendline is drawn. The magnitude of the inclines and dips determines the trend. An ascending price channel is defined by trendlines with a positive slope, indicating that the price is rising higher.
A downward or falling price channel, on the other hand, has trendlines with a negative slope, suggesting that the price is heading lower with each price change.
A price channel’s two lines symbolize support and resistance. Support and resistance lines can be used to generate signals for effective trades.
Price Channel indicator trading strategy
There are a few ways to take advantage of the indicator. You have the greatest opportunity to gain when a pair follows a delineated price channel path.
Indicator buy setup
- Price should close above the upper channel
- Wait for the confirmation candle to appear
- Enter at the confirmation candle
- Place a stop-loss near the recent low
- Exit when the price falls below the upper channel
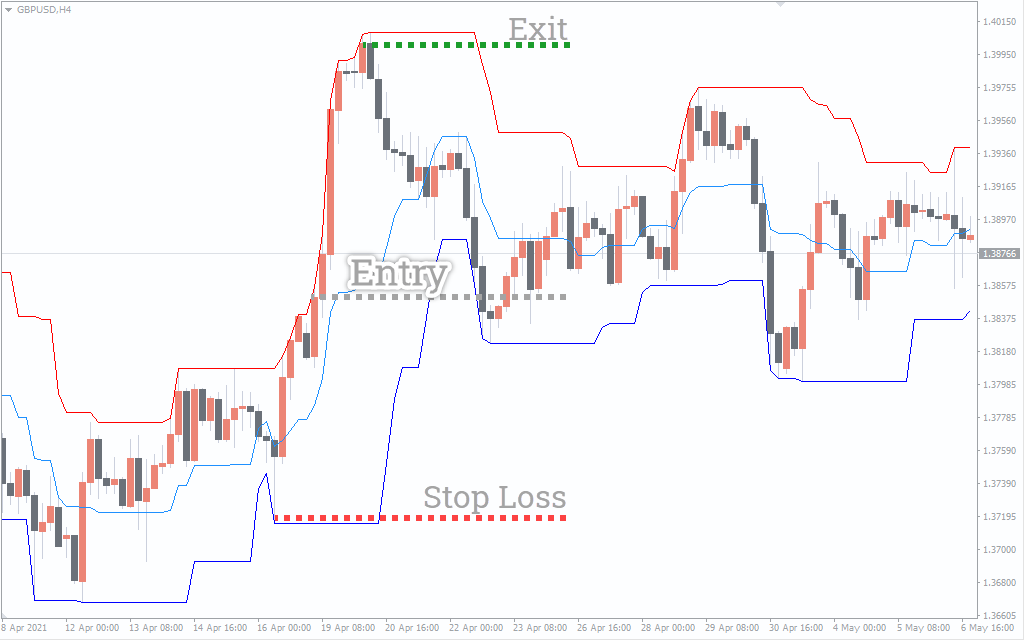
Indicator sell setup
- Price should close below the lower channel
- Wait for the confirmation candle to appear
- Enter at the confirmation candle
- Place a stop-loss near the recent high
- Exit when the price rises above the lower channel
Bottom line
The indicator allows you to take gain from the price bounce between the support and resistance lines. It also helps in identifying breakouts.
As always, it is best to combine the indicator with other indicators to confirm the price trend.