

Parabolic Sar Indicator
Get accurate BUY and SELL signals with the top Parabolic SAR Indicator for MT5. Start it and easily identify trend directions and reversals.
Description
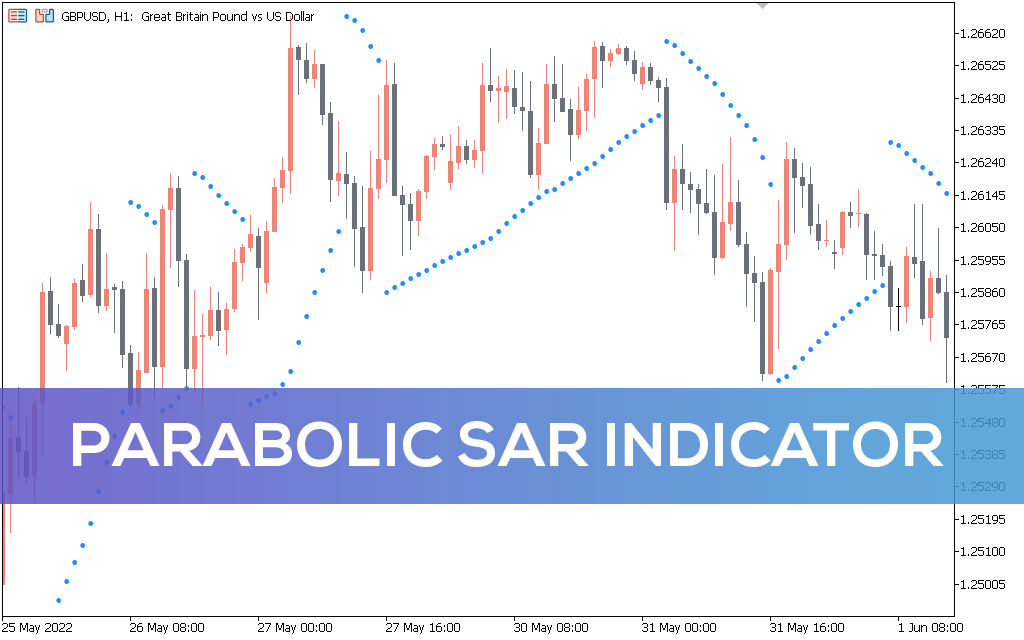
The Parabolic Sar indicator is a simple MT5 indicator that reports the direction of a trend. Parabolic Sar, developed by J. Wilder, is one of the classic indicators. It detects market trends and reversals by plotting dotted lines on the chart.
These dots appear above or below the price action and move with the trend.
Traders can apply the indicator on any time frame; however, it is best to use it on longer timeframes to reduce market noise.
Parabolic Sar Indicator for MT5 BUY/SELL signals
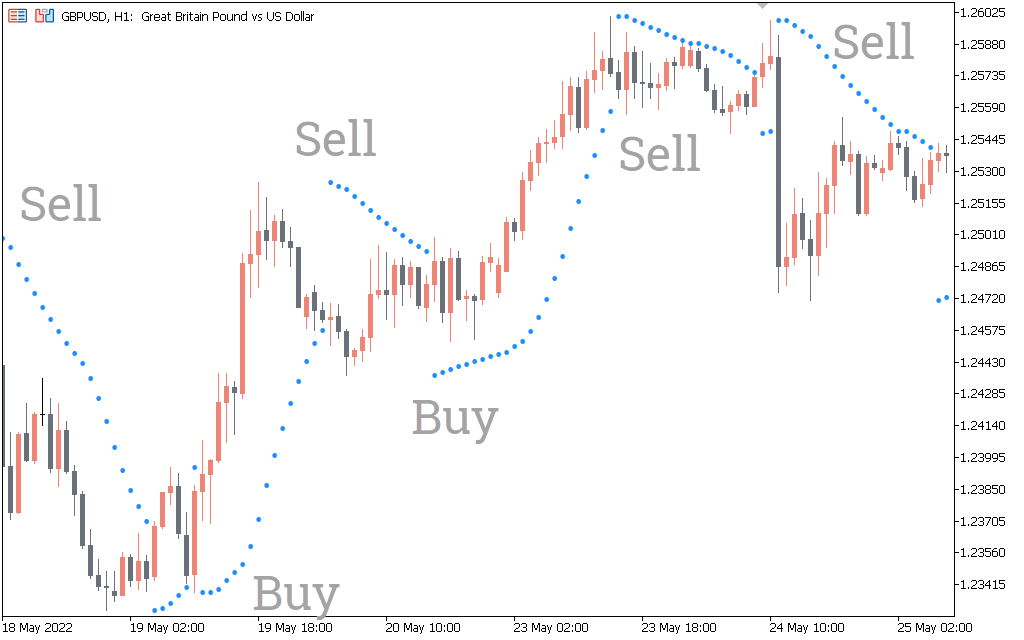
The above GBP/USD H1 chart shows the indicator’s BUY and SELL signals. To look for BUY and SELL signals, traders need to look at the dots. The dots move from one side to the other. If the dots start to move below the price, this is a potential uptrend and traders can enter long or exit short positions.
Conversely, if the dots move above the price, it means a downtrend and traders can go short or close long. It is important to note that during a trend, the dots move with the price. For example, dots will stay below the price if there is an uptrend.
The indicator works best with moving averages and traders often combine them for trading strategies.
Conclusion
The Parabolic Sar indicator is a classic indicator that draws dotted lines on the chart. By analyzing the dotted lines, traders can open BUY or SELL positions. If you want to download the Parabolic-sar indicator, you can download the indicator for free on our website.