

NRTR Indicator
Forex BUY and SELL signals from the best NRTR Indicator. Plots support and resistance lines to detect trend direction.
Description
The NRTR is a simple indicator that draws lines and dots on the chart to tell the trend’s direction. The NRTR has an abbreviation of Nick Rypock Trailing Reverse). The Indicator gets the name because of the surname of its developer. Surprisingly, NRTR has been around since 2001.
The NRTR was developed to detect the potential reversals. Now, the Indicator detects reversals alongside entry points. The Indicator plots five lines having a period of 10, acting as support and resistance. The names of these lines are R1, R2, R3, P1, and S1.
If there is a downtrend, then Indicator plots more resistance lines. On the contrary, if there is an uptrend, then the Indicator plots only one support line. The P1 act as a neutral line, and traders must wait for price action to move in either direction.
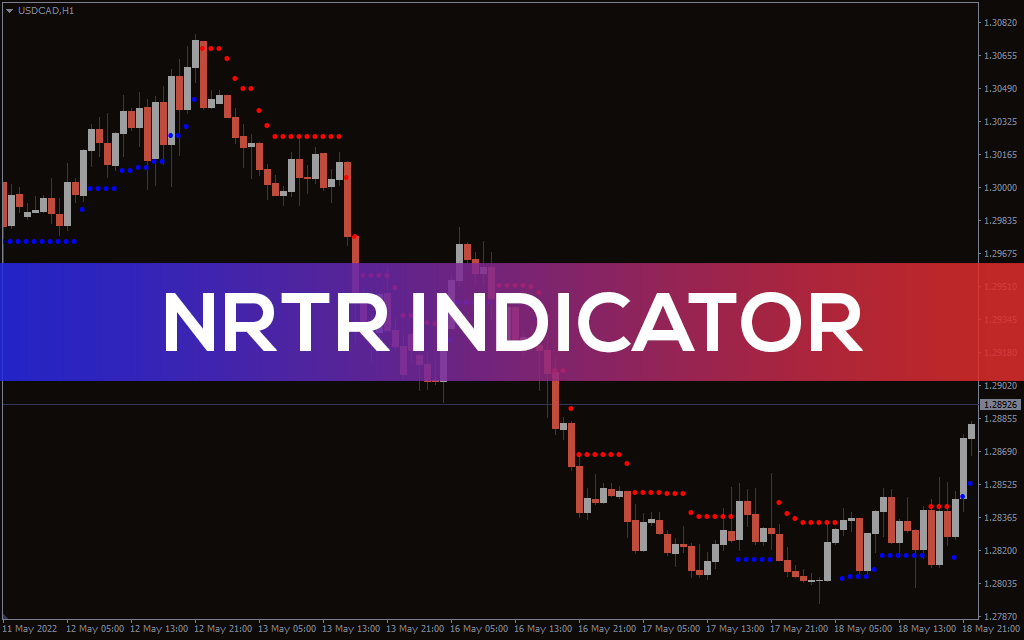
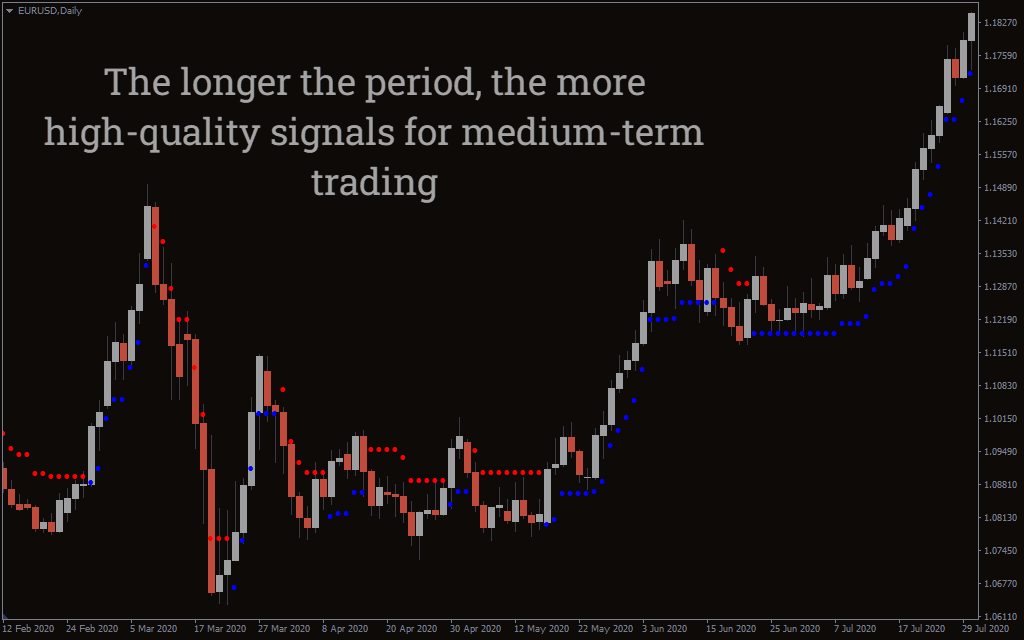
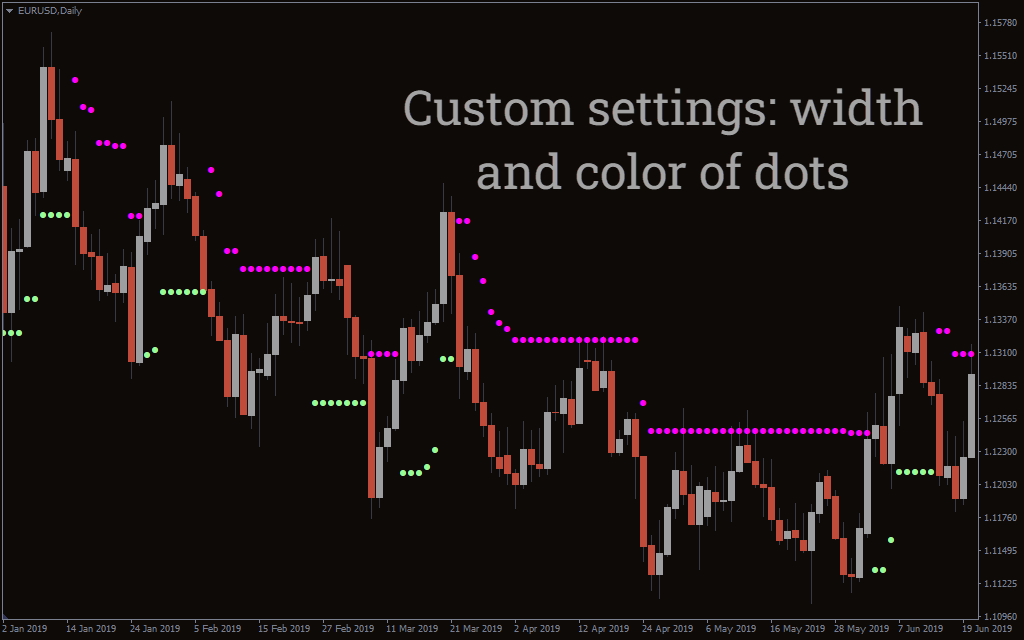
Along the lines, we have the dots that act as an additional signal confirmation. The appearance of the red dots suggests a downward trend, while the emergence of the blue dots illustrates an uptrend. The NRTR Indicator works best on every timeframe. However, it’s best to apply the Indicator on longer timeframes.
NRTR Indicator BUY/SELL signals
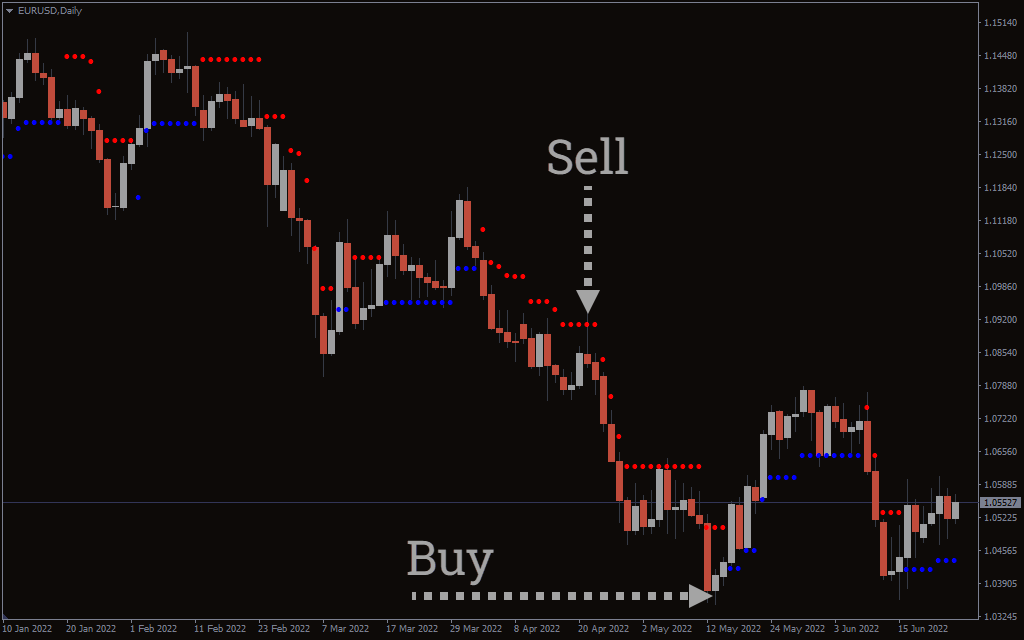
The above EUR/USD Daily chart shows BUY and SELL signals with the Indicator. To determine the BUY and SELL signals, traders must identify support and resistance lines along with the red and blue dots.
To enter long positions, the Indicator should satisfy two conditions:
- The price should be below the S1 or near it.
- The blue dots should appear.
When the conditions are satisfied, traders can enter long or exit short positions.
To enter short, the NRTR indicator should mention the following conditions:
- The price should be above R3 or near it.
- The red dots should pop up.
When these two conditions are satisfied, traders can enter short or exit long positions. Sometimes the Indicator can plot blue or red dots between the P1 line and R1. Here traders must wait for the price action to continue in either direction and then enter the trade.
Sometimes the price can stay between P1 and R1 for a longer time. Here traders need to wait for the appearance of the dots to enter or exit their positions. The NRTR Indicator works best by itself, but traders can apply other indicators like the RSI or MACD.
Conclusion
The NRTR Indicator plots support and resistance lines alongside the dots to tell the direction of the trend. Traders can find exact entry and exit points with the help of an indicator. In addition, you can download the Indicator for free from our website.