

Best Market Profile Indicator
Find out the exact location of price action using the Market Profile Indicator for MT5.
Description
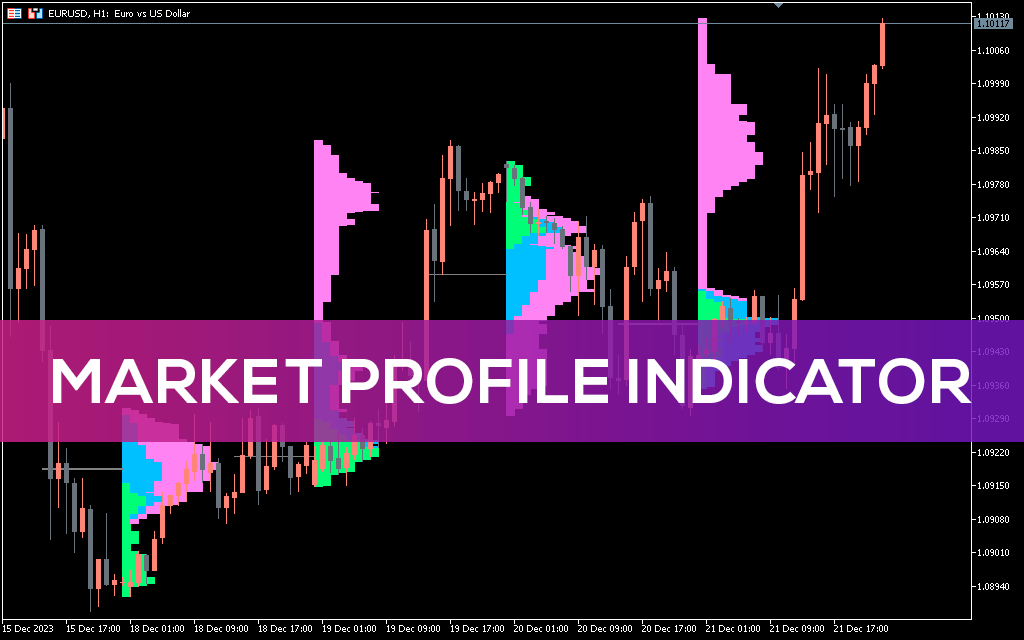
The Market Profile indicator displays price density over time, highlighting the most important price levels, range and benchmark for a specific trading session.
The indicator is built by combining data on volume, time and number of ticks at certain levels over a certain period.
In this guide, we will dive deeper into what the MP Trendlines indicator is and how you can use it in your trading approach.
What is a market profile trend line indicator?
The Market Profile indicator was developed by a trader at the Chicago Board of Trade (CBOT). Its original purpose was to display price and time information collected during a trading session in a form that you could understand.
The MP Trendlines indicator differs from the traditional one in that it includes trend lines. Additionally, this indicator analyzes where the most price activity is occurring in a currency pair or other market at any given point in time.
It calculates using the most accurate tick data – every tick/market change. The Market Profile indicator generates a histogram based on this.
A histogram simply displays where there is active trading activity and price movement at certain price levels and zones. From right to left, the indicator draws a histogram. Unlike the typical left-to-right layout, it can be helpful to focus on the current trading session without complicating your chart.
With this indicator, you will always be aware of the most important price levels and price zones for future price movements in any market.
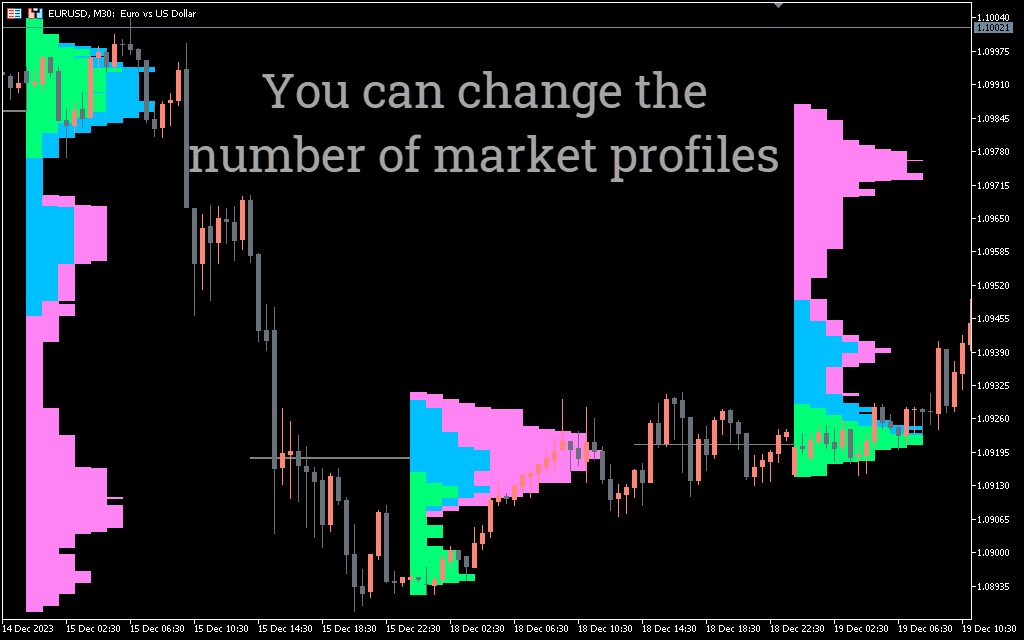
The Market Profile indicator can be applied to time frames from M1 to D1 and display profiles of trading sessions. This indication is based solely on price action and does not use regular MetaTrader indicators.
How to use the Market Profile indicator?
The value area is the main use of the Market Profile indicator.
The price will fluctuate up and down depending on buy and sell orders as the market develops during the session. This indicator calculates the combination of time, volume and tick data, after which a range of values is formed.
This price range represents the midpoint between current supply and demand levels. In addition to the value area, you will be represented by two tails; upper and lower market profiles.
Trading strategy using the Market Profile indicator
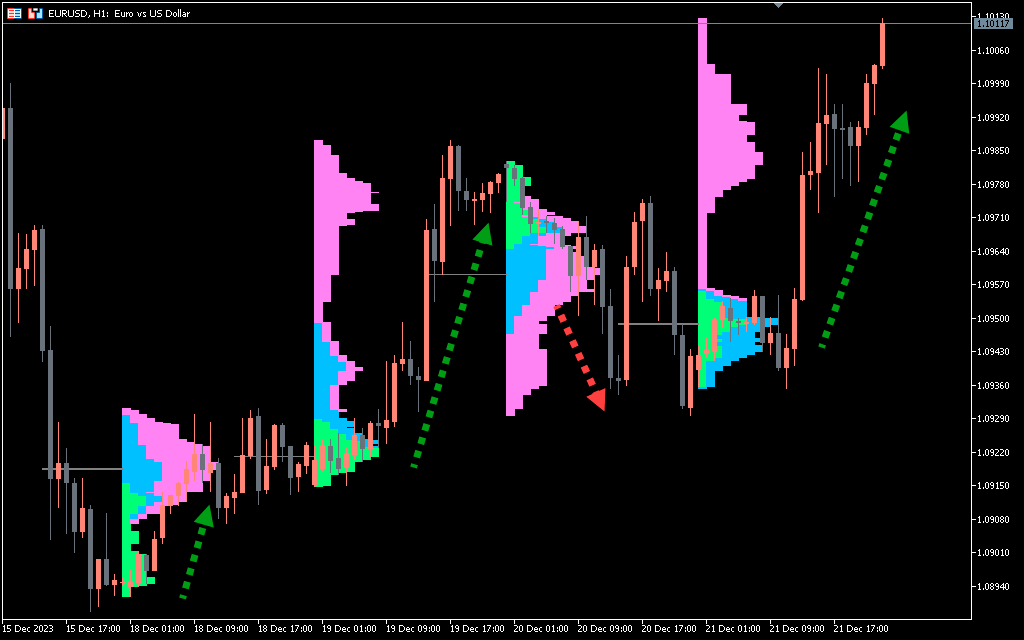
Price areas rejected by the market are indicated by large tails below and above the value area. The lower tail tells us that buyers are outpacing sellers at these price levels. On the other hand, the upper tail tells us that sellers are ahead of buyers at the appropriate price levels.
Buy setup
- Find the lower boundary on the graph.
- Wait until the price turns bullish.
- Place a stop loss near the recent low.
- Exit when the trend changes direction.
Sell setup
- Find the top of the diagram.
- Wait until the price turns bearish.
- Place a stop loss near the recent high.
- Exit when the trend changes direction.
Conclusion
The Market Profile indicator is a great tool for identifying every price movement in the current period. It is better to use the indicator with other technical analyses, such as simple moving averages, to confirm the direction of price action.