

MACD on RSI Indicator
Forex BUY and SELL signals from the best: MACD on RSI Indicator. Combines MACD and the RSI to detect trend direction.
Description
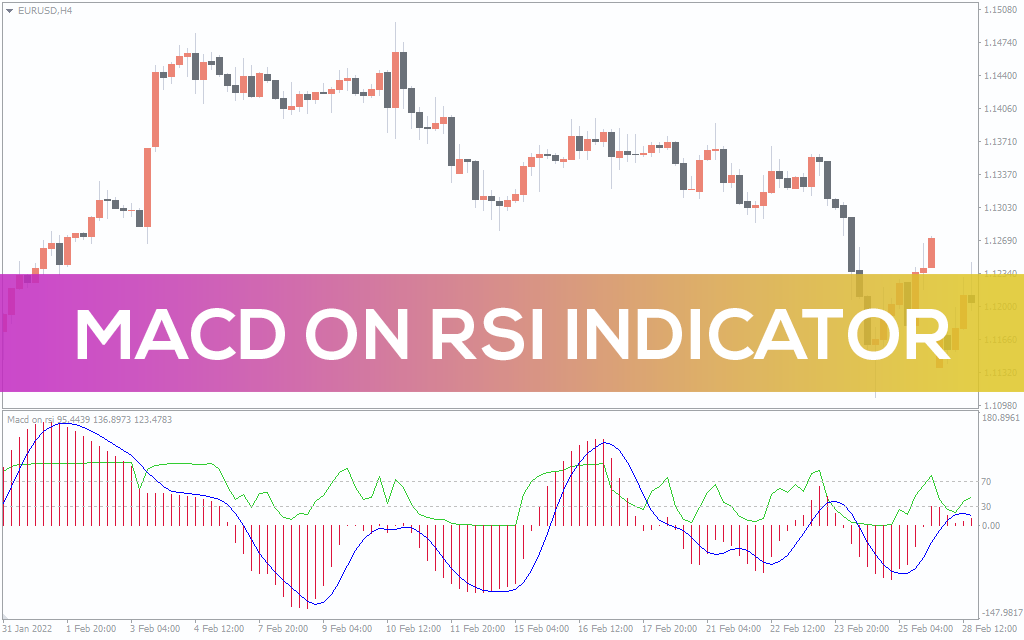
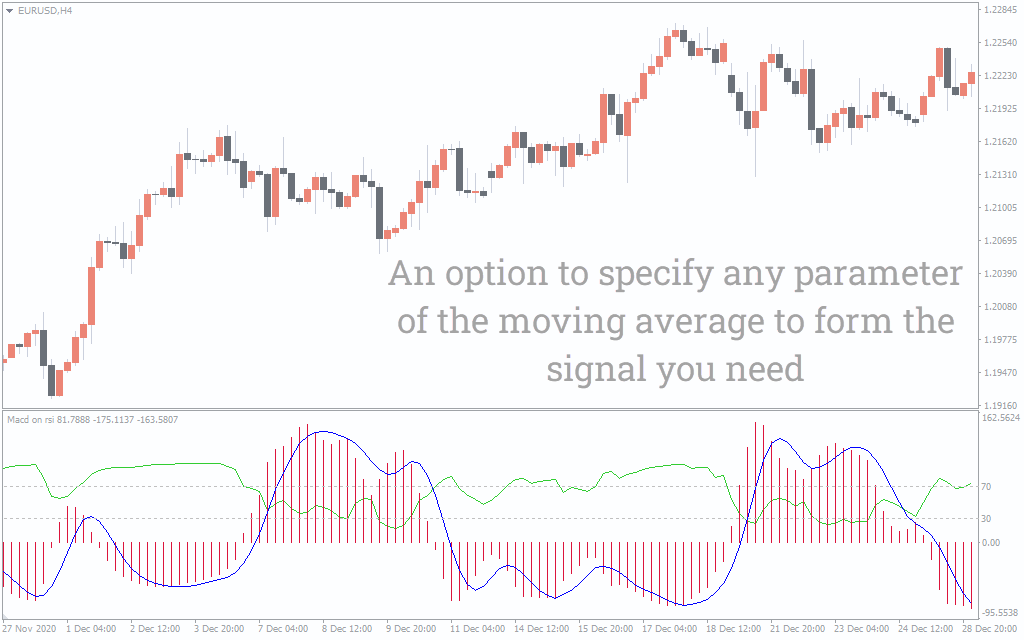
The MACD on RSI Indicator is a simple indicator that combines two of the best indicators of the forex market; RSI and MACD. The indicator comprises three moving averages: fast EMA, slow EMA, and signals SMA. Along with them, there is also a general MA of 5-period. Here the green line represents the fast EMA, while the blue line marks the slow EMA.
Usually, MACD draws a histogram below the chart. The MACD on RSI Indicator, the MACD draws bars to tell about the overall trend direction. Here the RSI compliments the MACD by mentioning overbought and oversold conditions. Like the traditional RSI, when the price is above 70, the indicator shows an overbought condition. Conversely, when the indicator goes at or below 30, it shows the oversold conditions.
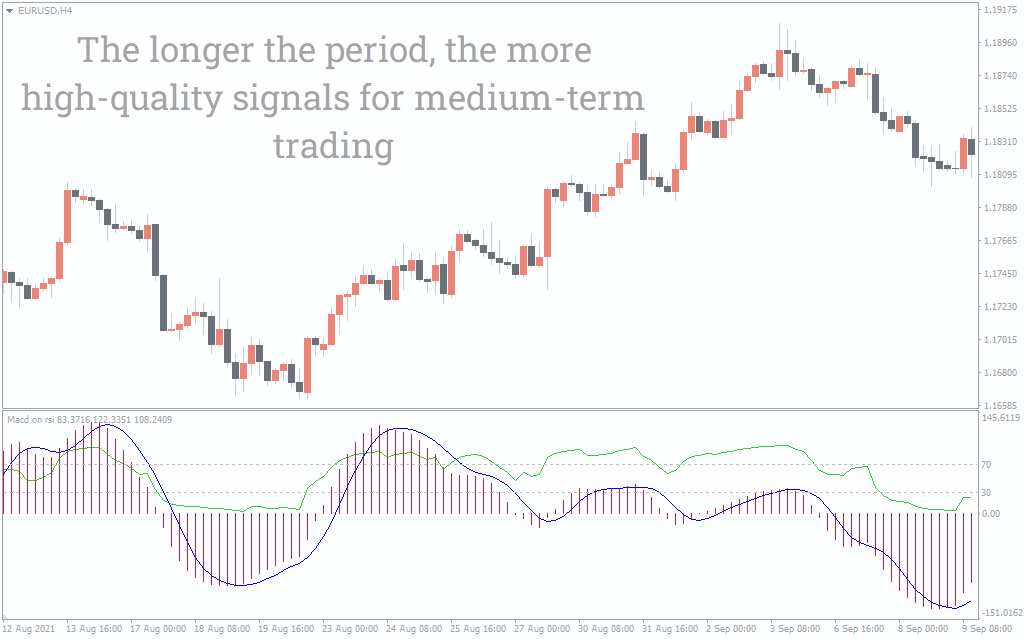
As the indicator is a momentum indicator, MACD on RSI Indicator oscillates between certain levels. The MACD on RSI Indicator works best on every timeframe. However, it’s best to apply the indicator on longer timeframes.
MACD on RSI Indicator BUY/SELL signals
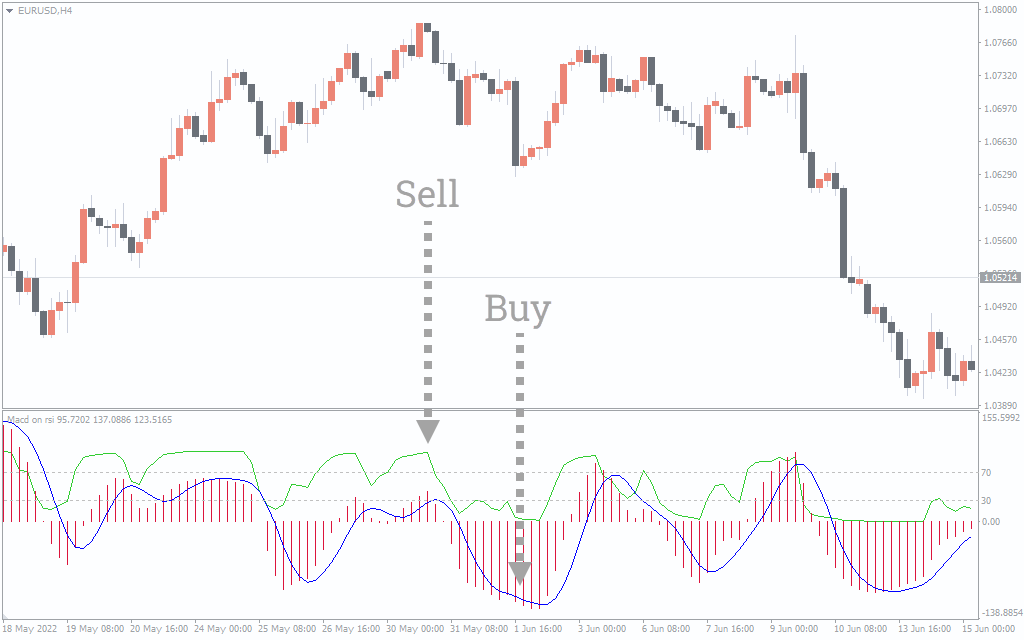
The above EUR/USD H4 chart shows BUY and SELL signals with the indicator. To determine the BUY and SELL signals, traders must identify overbought and oversold conditions. To enter long, traders need to locate certain conditions. Firstly, the bars should be in oversold territory. Secondly, the fast EMA should be below the slow EMA.
Sometimes the indicator does satisfy these conditions, but the price moves in the opposite direction. It is because of a choppy or ranging market. So, traders must wait for the price action to continue its upward momentum before entering the trade.
Conversely, to enter short, a trader needs to satisfy the following conditions:
Firstly, the bars should be in an overbought zone.Secondly, the slow EMA should be below the fast EMA. Like the BUY position, sometimes the indicator satisfies these conditions, but the price moves in the opposite direction. So, traders must wait for the price action to continue its downward momentum before entering the trade.
Conclusion
The MACD on RSI Indicator combines two momentum oscillators to present BUY and SELL signals. Traders can find exact entry and exit points with the help of an indicator. In addition, you can download the indicator for free from our website.