

Heiken Ashi Histogram Indicator
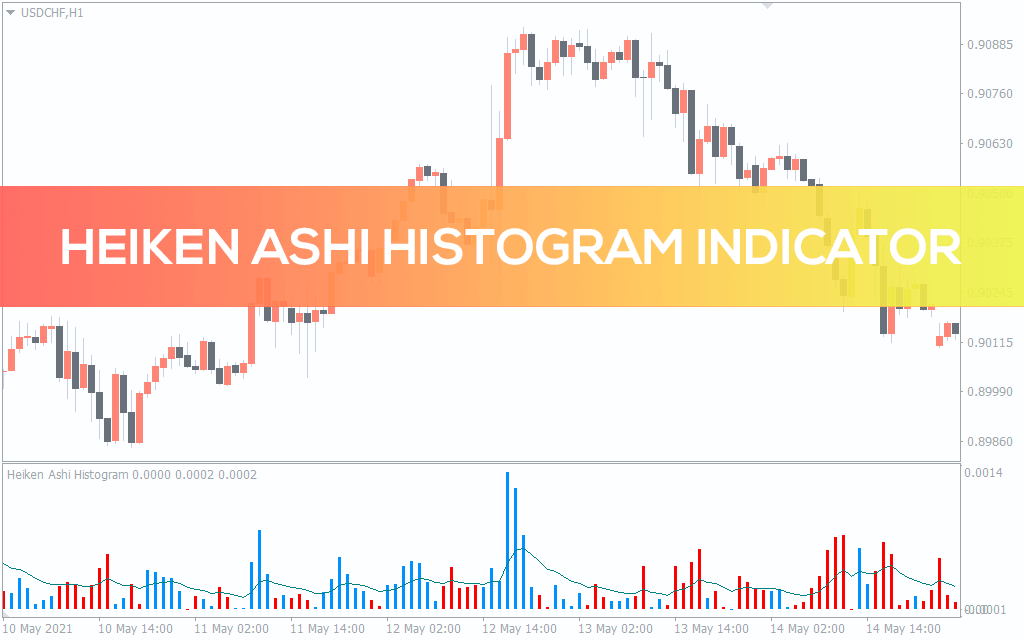
Excellent trend reversal detector. Free download. Heiken Ashi Histogram Indicator – is a great indicator for determining when the trend momentum is gaining traction.
Description
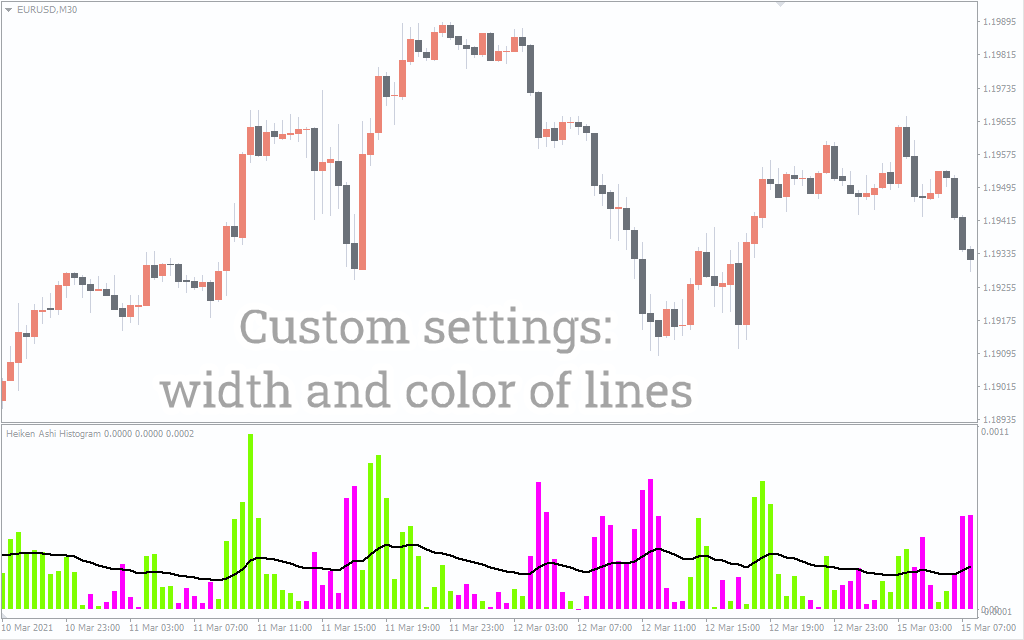
You guessed it right. Heiken Ashi is a Japanese name meaning a normal bar. The Heineken Ashi indicator for MT4 is a variation of the popular Heiken Ashi Oscillator. It features histograms and moving averages.
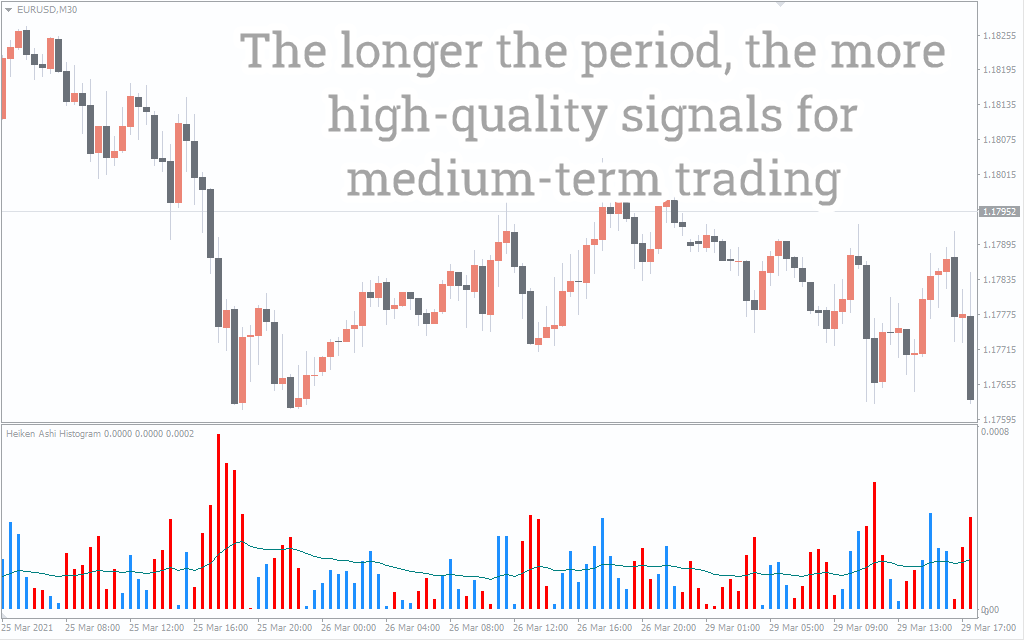
One of the advantages Heiken Ashi histogram indicator for MT4 is that it is easy to analyze. The histogram consists of blue and red bars. Prolonged periods of the same color bars provide more potent and reliable signals than two or three candles.
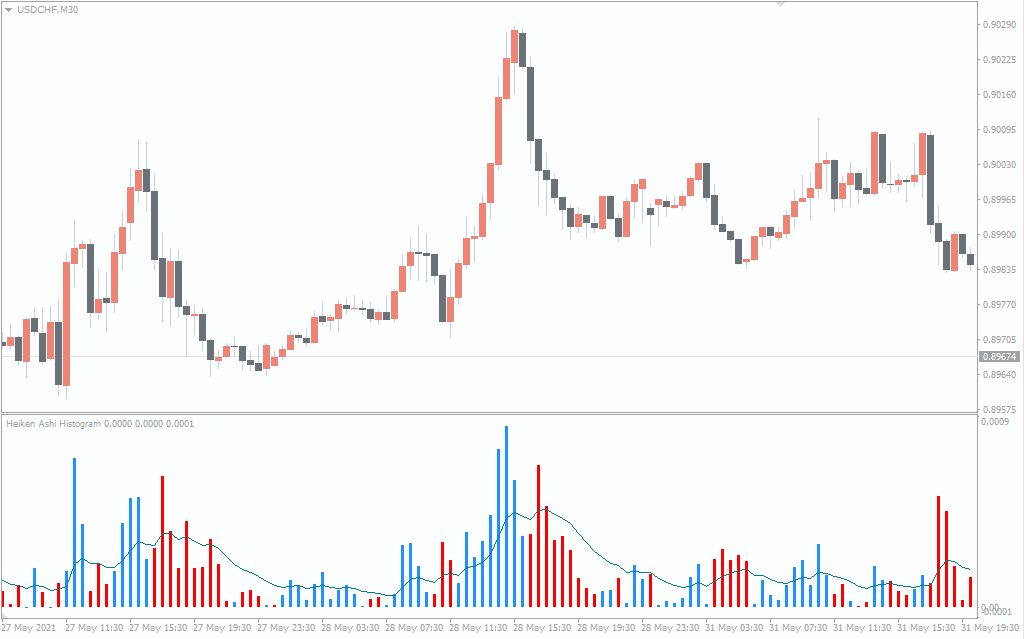
The indicator provides a trading signal when the histogram color changes and the bars cross over the moving average. This is a tell-tale sign that the market trend is enough to continue for a while. The moving average shows the average change and is an excellent tool for identifying range-bound markets.
The indicator uses historical data to help traders identify market peculiarities. In other words, it shows price dynamics that are difficult to identify using price action. Put differently, once you identify a perfect trade entry point, it helps determine if the trend will be strong enough to open a new position. In addition, it helps traders identify strong trends quickly.
Here is the interesting part. The Heiken Ashi histogram indicator is a universal indicator. This means that you can use it in any time frame and any currency pair. What more, you can use the indicator for swing trading, day trading, and scalping.
How to trade using the Ashi Heiken Histogram Indicator
The first thing is to identify the colors of the histogram bars. The light blue color signals an uptrend, while the red bar indicates a falling trend. However, you shouldn’t use the bar colors to enter the long or short position. You should also factor in the moving average.
A blue bar does not mean the price will rise, and neither do a few red bars mean the price will plummet. Ideally, you should wait for the bar to cross the moving average line. For instance, when the blue bars rise above the moving average, it is a tell-tale sign that the uptrend will persist for a substantial period. The same case applies to down trends. Wait until the red bar crosses the moving average. The further the bar rises after crossing the MA, the stronger the trend.
Here is an example
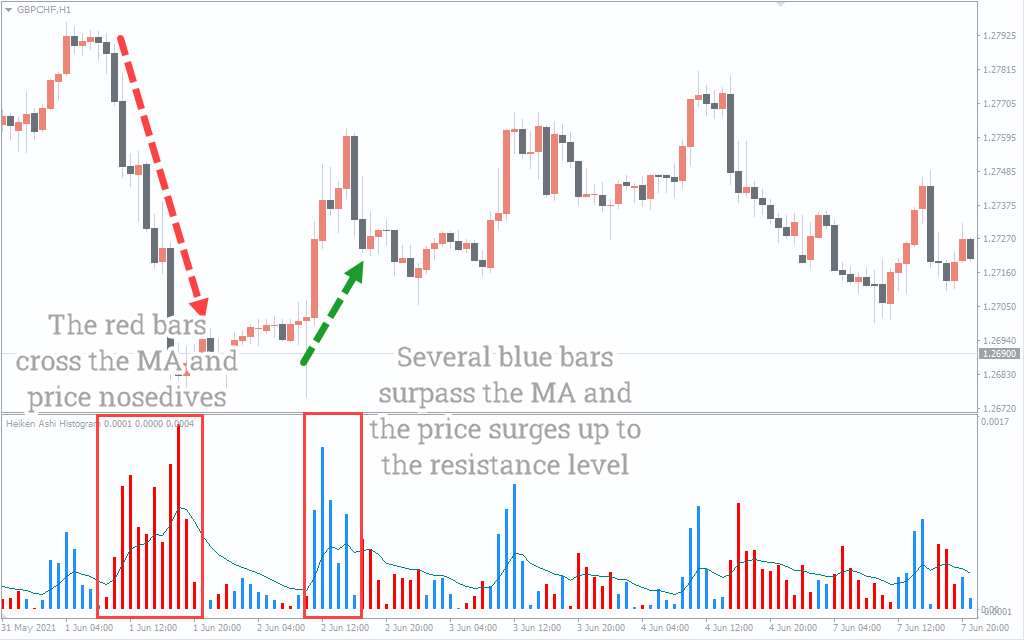
The above picture shows a chart of Great Britain Pound against the Swiss Franc. The blue arrow shows the price point when the red bars crossed over the moving averages denoting the beginning of a strong downtrend. In fact, the price declined around 100 pips which is a good profit regardless of the account size.
Similarly, the red arrow shows a price level when the price bars crossed the moving average, signaling a strong incoming uptrend. True to the indicator signal, the price surges about 50pips.
Final Word
The Heiken Ashi histogram indicator simply tells you when the trend will likely gain momentum and become stronger. It is prudent to use the indicator with other indicators and technical analysis tools. The Heiken Ashi histogram indicator is a simple, straightforward handy tool you should include in your trading arsenal.