

FIP Indicator
Forex market signals from the best FIP Indicator for MT4. Find market reversals with the help of arrows.
Description
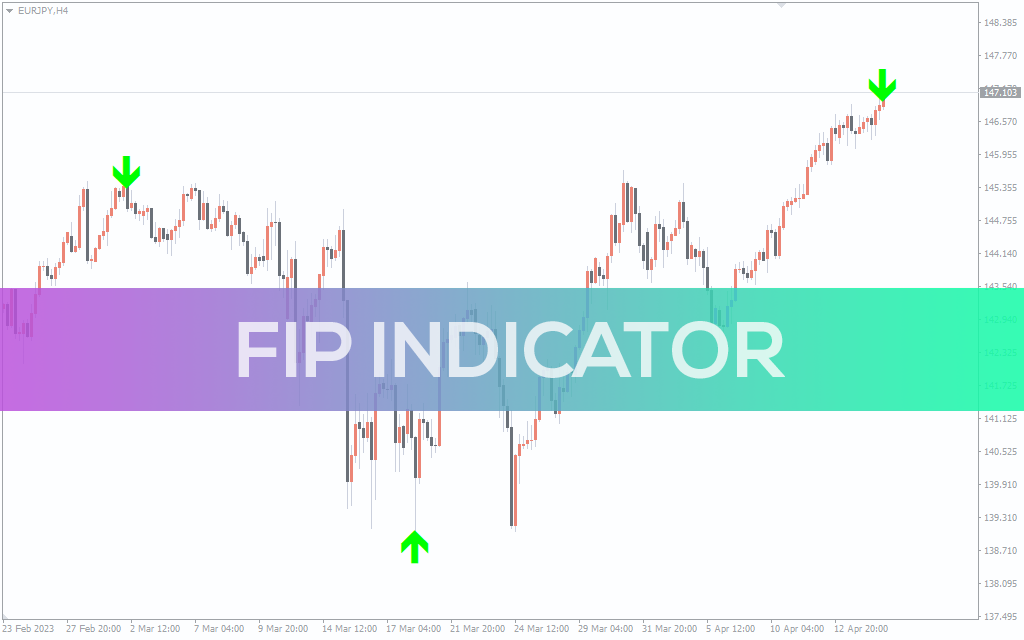
The FIP Indicator uses standard deviations to plot green arrows on the chart. These arrows appear at the end of a bullish or bearish trend and signify bullish/bearish reversals.
Although the indicator works on every timeframe, it’s better to apply it on longer timeframes, as it can plot multiple arrows on a shorter timeframe.
How to use the FIP Indicator for MT4?
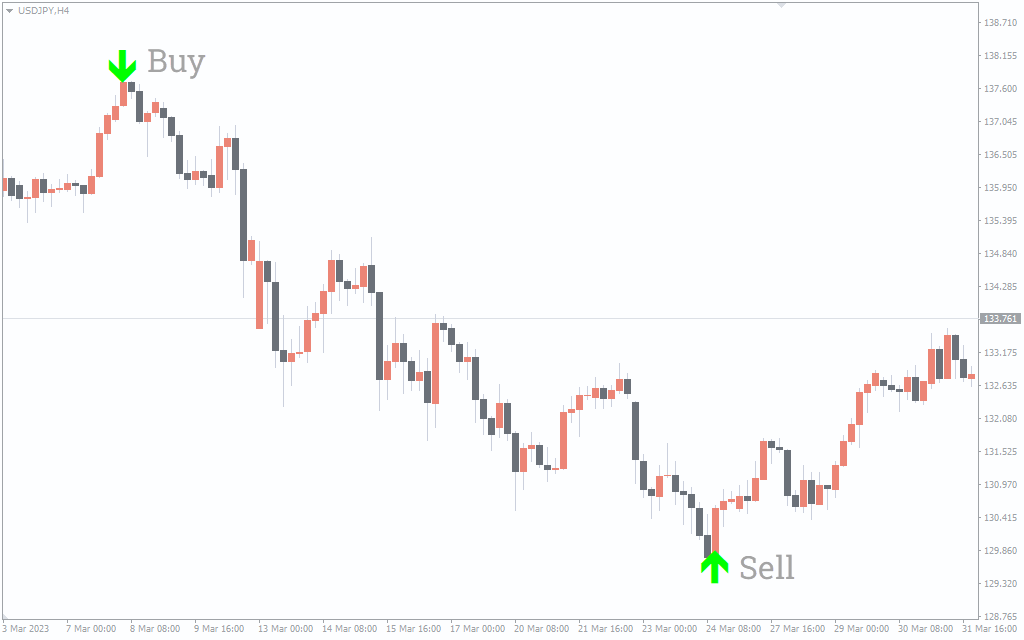
The above USD/JPY H4 chart shows the indicator BUY/SELL signals.
To find the trading signals, you have to look at the green arrows. The indicator plots an arrow whenever the trend finishes, suggesting a reversal.
It illustrates an arrow in a downtrend to mention a bullish reversal. On the other hand, it shows the green arrow in an uptrend to signify a bearish reversal. You can exit the trade when the next arrow appears.
The indicator plots non-repainting arrows so it doesn’t disappear from the chart. That’s why it can take longer to highlight the arrows.
Sometimes the FIP may draw an arrow, but the trend doesn’t reverse. So, to mitigate the risk, you can add other indicators or technical analysis tools for further confirmation.
Conclusion
The FIP Indicator for MT4 uses standard deviations to plot arrows on the chart. These arrows form in an uptrend/downtrend, highlighting bullish or bearish reversals. The indicator doesn’t repaint and can take longer to show an arrow.