

Double Stochastic RSI Indicator
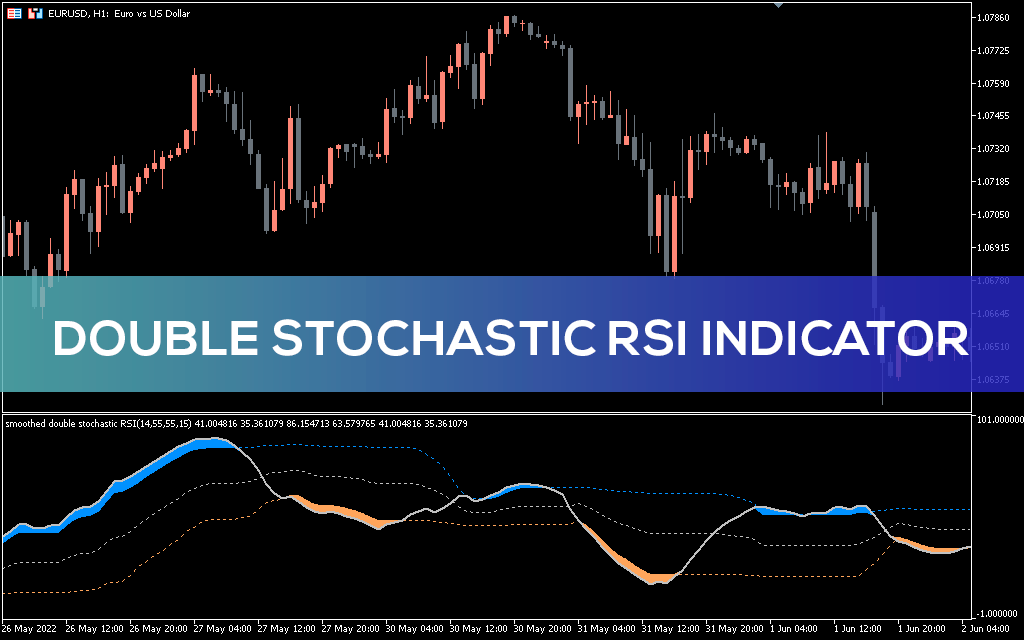
Double Stochastic RSI technical indicator is not repaint. It combines RSI and Stochastic, two forex oscillators that are considered the best for reversal trading.
Description
Stochastic (Stoch) and RSI are two classic oscillators that are considered the best for reversal trading. The main similarity between the Stochastic and RSI is that they show overbought and oversold zones for any market, be it on daily/weekly charts or intraday charts. The main difference is in the formulas and in the fact that the Stochastic is more sensitive than the RSI. Is RSI or Stochastic better? Which one should I choose? You can use them together at the same time thanks to the Double Stochastic RSI indicator.
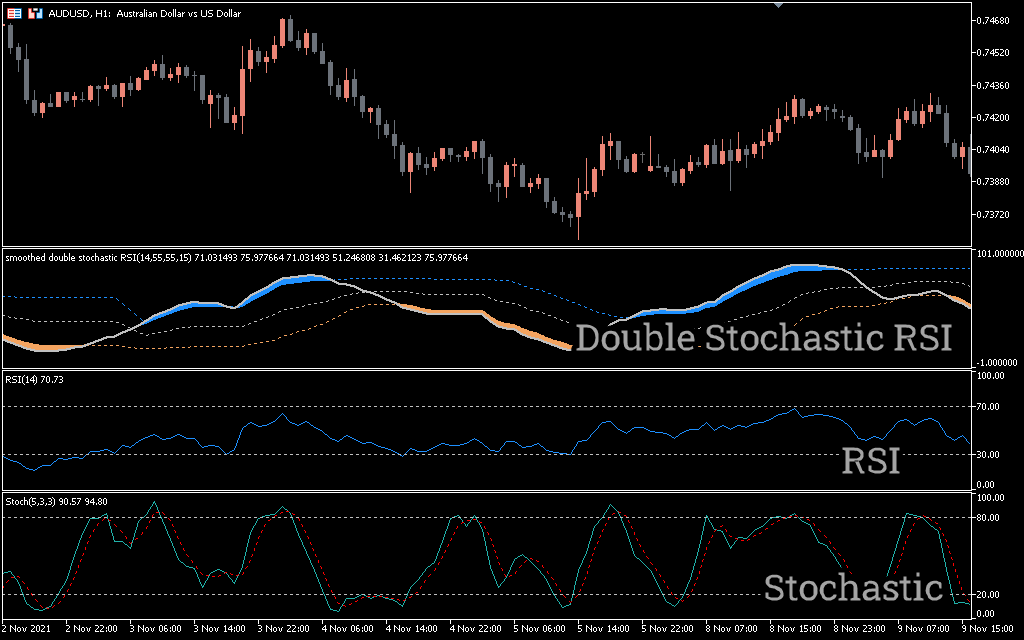
This indicator automatically analyzes price dynamics to identify overbought and oversold zones.
The indicator consists of:
- the main line, with values usually ranging between 0 and 100;
- two dynamic overbought and oversold levels.
How do you read the Stoch RSI Indicator?
If the values rise above the overbought level, the main line turns blue (colors can be customized to your liking). This is interpreted in two ways:
- either as a period of excessively high prices;
- or as a consequence of a sustained bullish trend.
If the Double Stochastic RSI falls below oversold levels, the main line turns orange. This is interpreted as a period of too low prices or as a result of a sustained bearish trend.
How accurate is the Double Stochastic RSI indicator?
Unfortunately (or fortunately for those who work hard during the day), there are no magical arrow indicators that would give guaranteed profitable buy and sell signals. The Double Stochastic RSI indicator will disappoint you if you are looking for a 5:1 profit/loss ratio.
Signal to buy with the Double Stochastic RSI indicator
In this example, a buy signal is generated when 2 conditions are met:
- Double Stochastic RSI indicator’s main line moves out of oversold territory.
- A test of the former resistance level forms on the price chart.
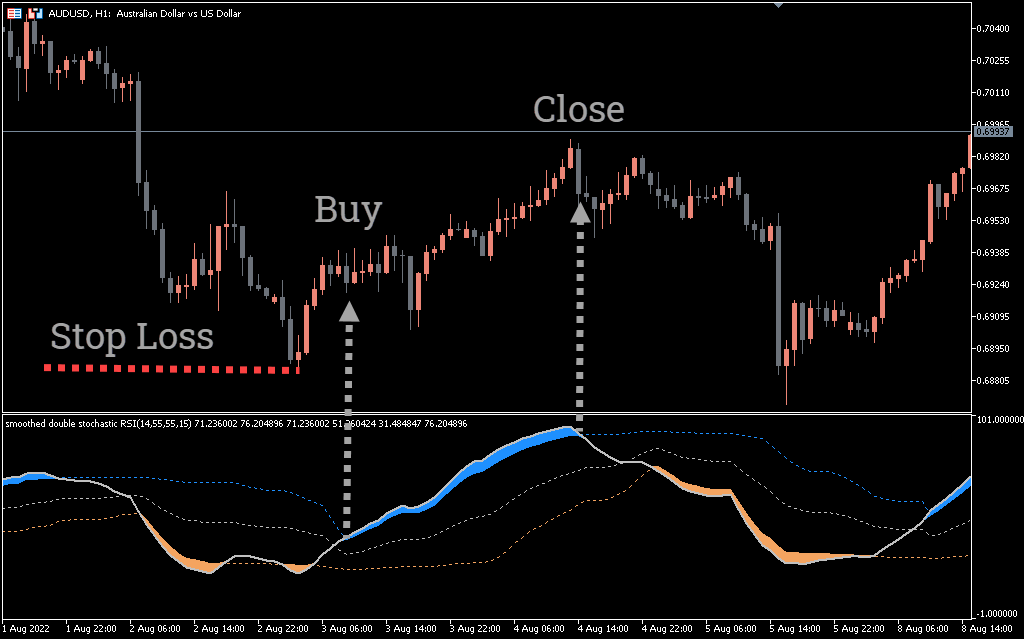
The chart above shows this situation. The weakening yen broke through the resistance level of 0.69250 against the background of the ultra-soft monetary policy of the central bank, the volumes increased. This is an indication that 0.69250 will work as support later.
When the price returned to the level, there was a reason to follow the indicator to get a signal to enter a long position. It is marked with an arrow and the inscription “Buy”.
Stop loss can be set in the classical way, under the previous local minimum. Take profit when there is a counter signal (marked with the second arrow) or other signs of danger.
Sell Signal
In this example, a sell signal is formed when 2 conditions are met:
- Double Stochastic RSI indicator’s main line moves out of the overbought zone.
- The moving average indicates a bearish trend.
The Double Stochastic RSI indicator gives a signal to enter a short position when the main line leaves the overbought zone and changes color to gray.
Stop loss can be set above the previous local maximum. Profit can be taken in the presence of a counter signal or using your preferred money management methods.
Conclusion
The Double Stochastic RSI indicator for Metatrader 5 combines two classic oscillators to find overbought and oversold zones. Does not repaint.
Benefits of this indicator:
- allows you to find entry points into a position;
- has flexible settings;
- can be applied to forex, crypto, equities and other markets;
- can be used by investors on daily and weekly price charts.
Disadvantages:
- doesn’t contain alerts;
- generates a lot of false signals. To increase the accuracy of the signals, try to combine the Double Stochastic RSI indicator with various methods of technical analysis – for example, candle patterns, or support and resistance levels.
Which indicator works best with Stochastic RSI? Try volumetric analysis.
Before risking real money, practice trading with the indicator on a demo account with your preferred forex broker.
Download the Double Stochastic RSI Indicator for MT5 for Free Now!