

Dolly Graphics v11 GMT Shift Indicator
Forex market entry and exit from the best Dolly Graphics v11 GMT Shift Indicator for MT4. Free Download. Find the buy and sell zones.
Description
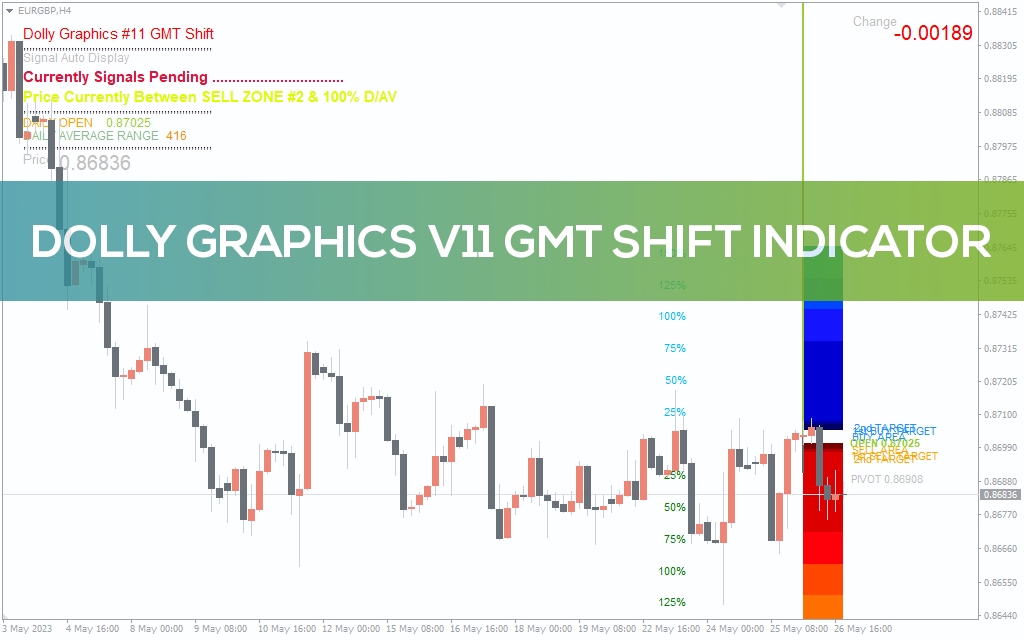
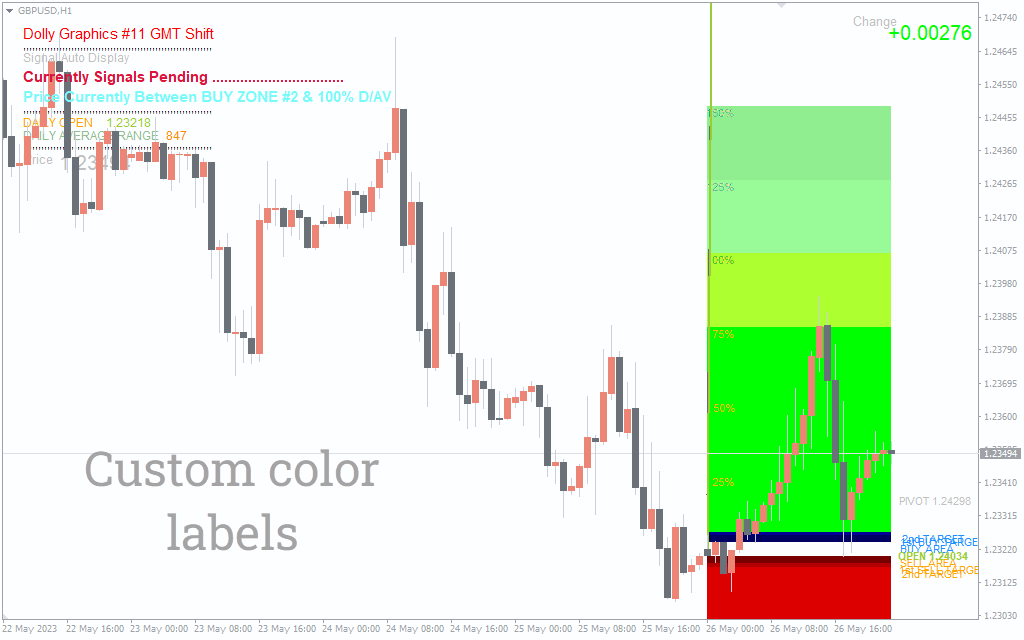
The Dolly Graphics v11 GMT Shift Indicator is a pivot-based indicator that provides valuable information about buy and sell zones. The indicator uses pivot points, key levels calculated based on the previous high, low, and close prices. These pivot points act as potential support and resistance levels.
The indicator employs a color-coded system to indicate different trading zones. In addition to the buy and sell zones, this indicator provides info on daily open, daily range, and GMT zone shifts.
How To Use the Dolly Graphics v11 GMT Shift Indicator for MT4?
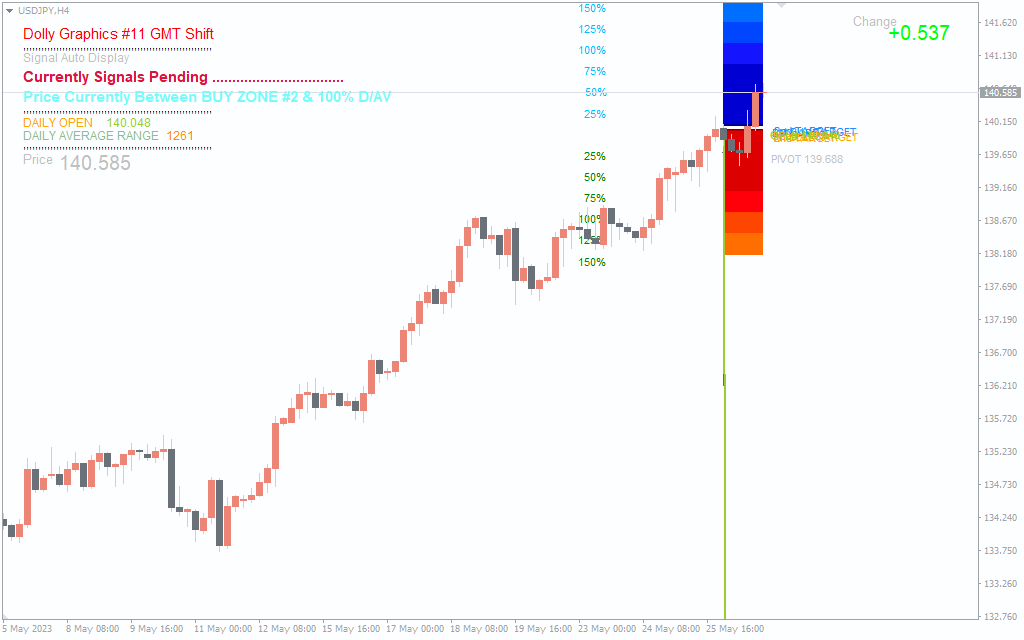
The above USD/JPY H4 chart shows the indicator on the chart. When the indicator displays a blue or dark blue color, it signifies a buy signal. On the other hand, when the indicator shows a red or maroon color, it represents a sell signal.
The color-coded signals in this indicator make it easier to quickly identify potential buying and selling opportunities based on the indicator’s analysis of pivot points and price action.
It is important to note that indicator can generate false signals when there is high volatility. So, it’s better to apply it to other forms of technical analysis.
Conclusion
The Dolly Graphics v11 GMT Shift Indicator is based on the pivot points and displays the buy and sell zones. By looking at these zones, you can enter or exit the trades.