

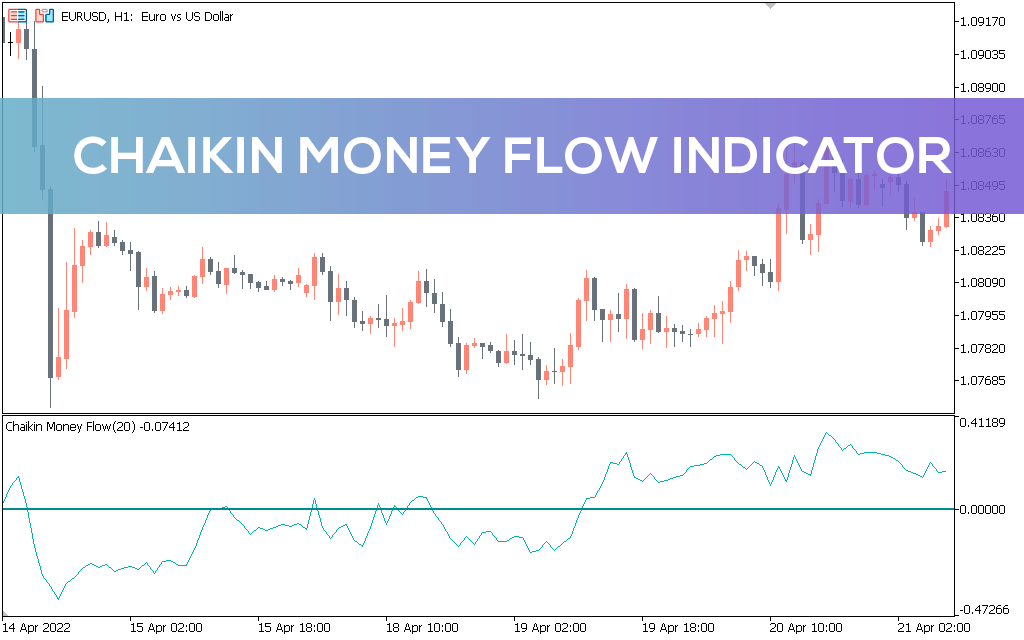
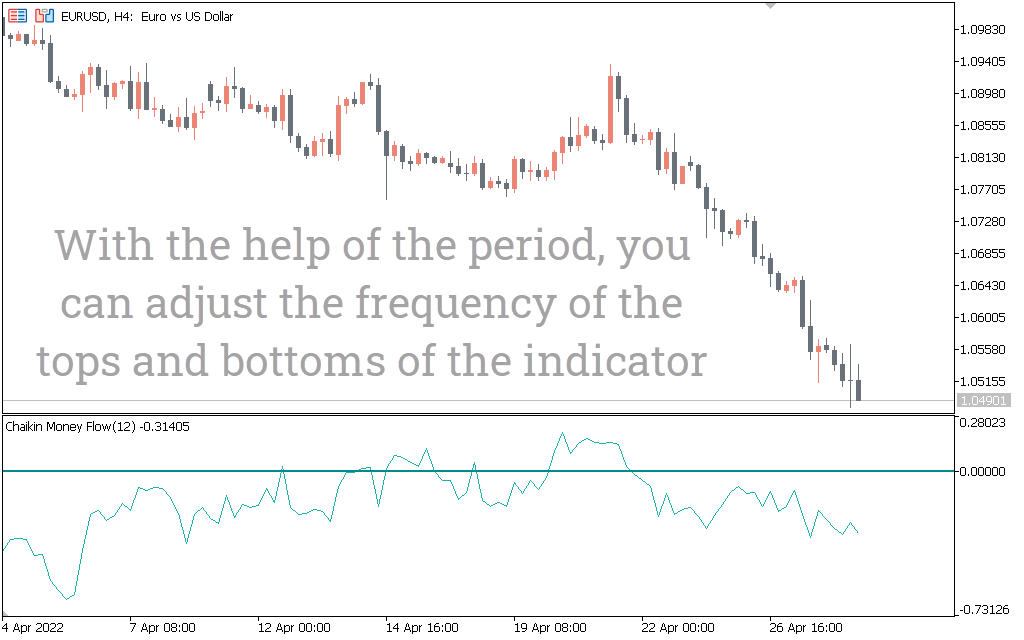
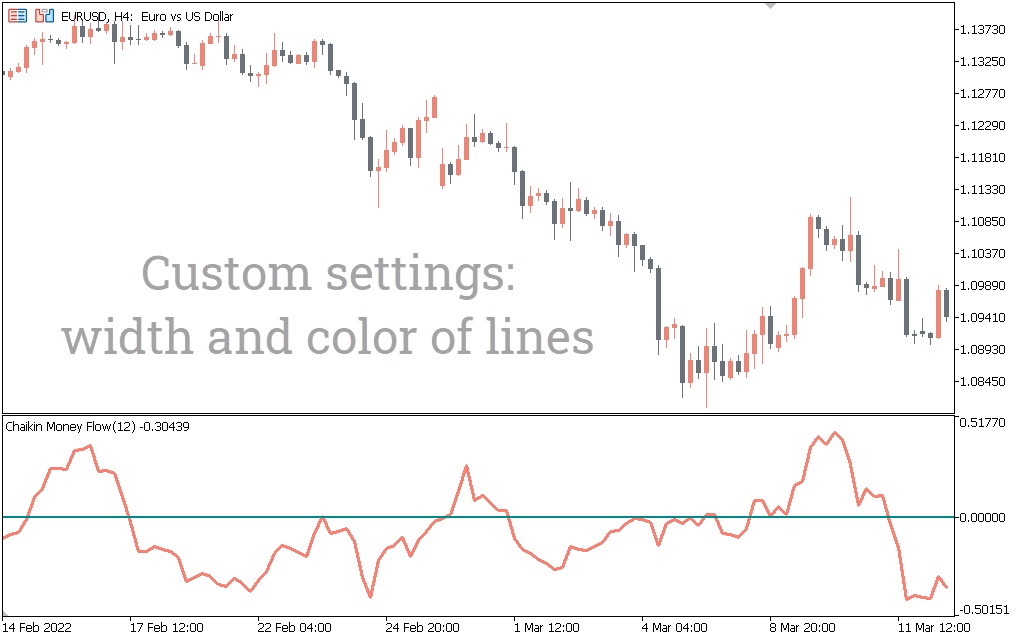
Chaikin Money Flow (CMF) Indicator
Chaikin Money Flow is an easy to use trend trading indicator. A trend reversal detector that is ideal for all traders.
Description
Mark Chaikin developed the Chaikin Money Flow (CMF) indicator to measure money flow over a specific period – 20 days by default. It determines the flow of money by combining volume and price. Traders can use the indicator to see if investors are accumulating an asset by buying or distributing by selling.
Having detected a change in the movement of the flow, a trader can anticipate a price change quite early and catch its reversal. Chaikin Money Flow Indicator for MT5 – free download, can be used to trade any currency pair on any timeframe.
How to Trade Using the Chaikin Money Flow Indicator
The indicator is based on the theory that price closes in the upper half of the daily range as market strength increases. Similarly, price consistently closing in the lower half of the daily range indicates declining market strength. Therefore, the indicator is designed to determine the market trend.
The indicator value increases when the asset crosses the high of the trading session. It decreases when the close is close to the low of trading sessions.
The indicator is designed to fluctuate between 1 and -1. When the value is in the positive area, the market is under bullish pressure. Similarly, the market is under bearish pressure if the price is in negative territory.
Now how do you trade with the indicator?
Buy Signal Chaikin Money Flow
This indicator gives a bullish signal when the readings are above the zero line. This is a sign that the market is strong and you should be looking to buy. In addition, the value of the indicator should increase as the price rises. A bullish signal is a sign of buying pressure, which represents accumulation.
Sell Signal Chaikin Money Flow
Likewise, a negative reading (below the zero line) indicates a weak market or bearish signal. Therefore, you must be looking to sell. The value of the indicator falls as prices fall. Selling pressure is a sign of distribution.
Chart Example
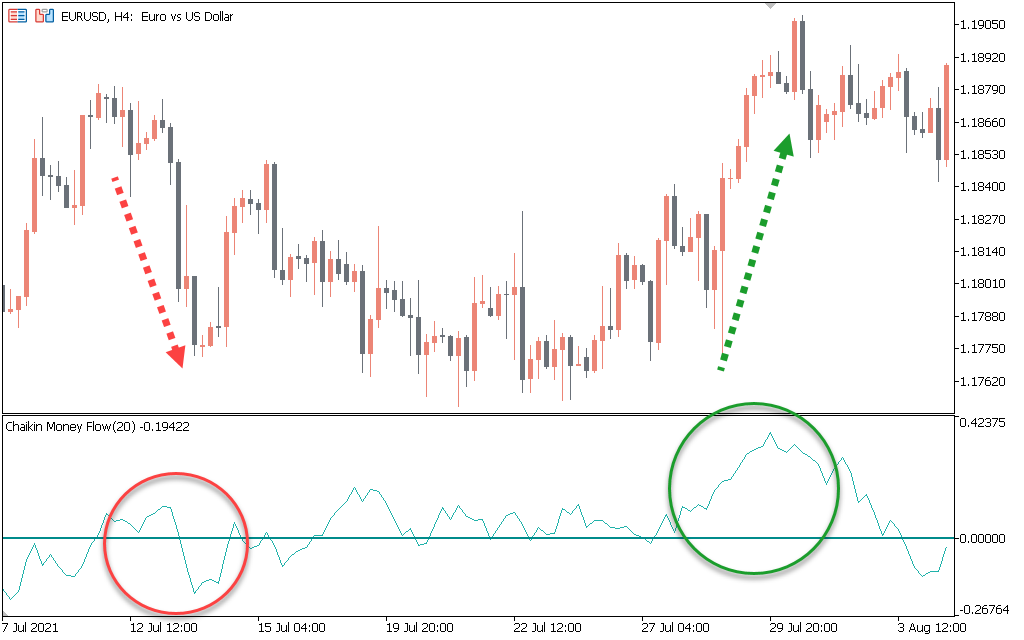
The above figure shows the movement of the price of the euro against the US dollar on a four-hour time frame. The red circle shows the price movement for the indicator movement when the market is bearish. Notice how the value of the indicator changes from positive to negative as the price falls sharply. A closer look at the price chart shows that the EUR/USD candles closed near the session low. The indicator interprets and presents this data as falling values of the indicator, as shown in the figure.
Similarly, during an uptrend, the indicator values increase. Moreover, session prices close near the session high, hence the rising line of the indicator. In fact, the indicator line moves up to the maximum values as the price approaches the resistance levels. Notice how the indicator goes from negative to positive, as shown in the green circle.
Conclusion
Chaikin Money Flow is one of the best indicators for trend trading. It tells investors when traders are accumulating an asset by buying and distributing by selling. Therefore, it is easy to determine the strength of the trend from them. In addition, it can help detect trend reversals. Like other indicators, the Chaikin Money Flow Indicator is best used when converging with different strategies and tools.