

Barrows Swing Indicator
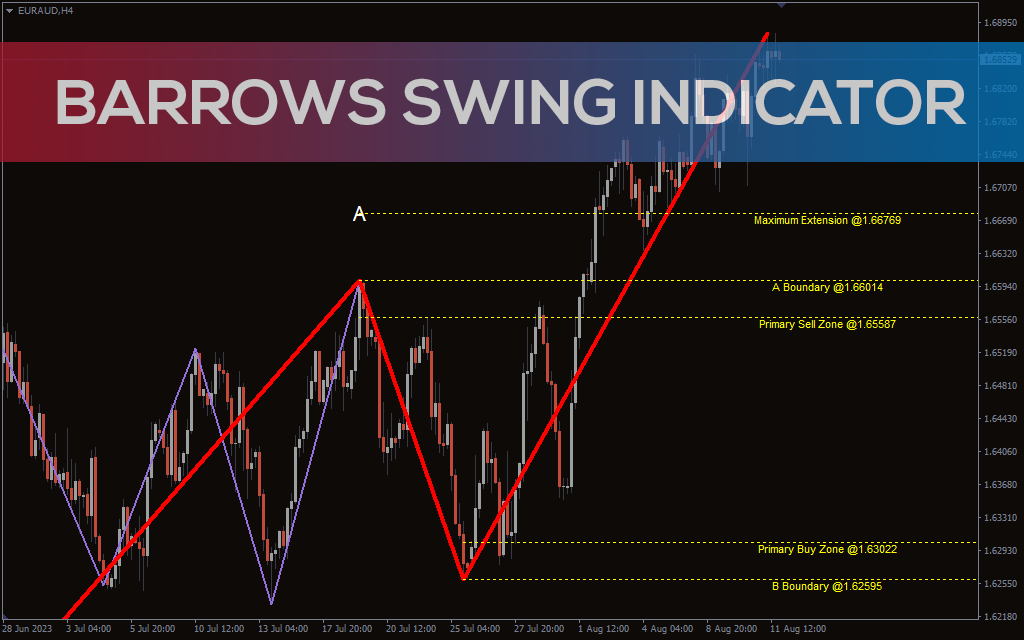
The Barrows Swing Indicator represents the potential buy and sell zones on the chart.
Description
The Barrows Swing Indicator draws the potential buy and sell zones. The indicator also plots the extreme levels on both up and down.
It identifies the swing lows and highs and plots the waves X, A, B, C, D, and E. Hence, you can find harmonic patterns as well.
You can use the tool at any timeframe. Notice that the levels are different for each timeframe. However, the probability increases when used on higher timeframes.
The indicator can be used in different ways. Let’s explore further about it.
How to Use the Barrows Swing Indicator for MT4?
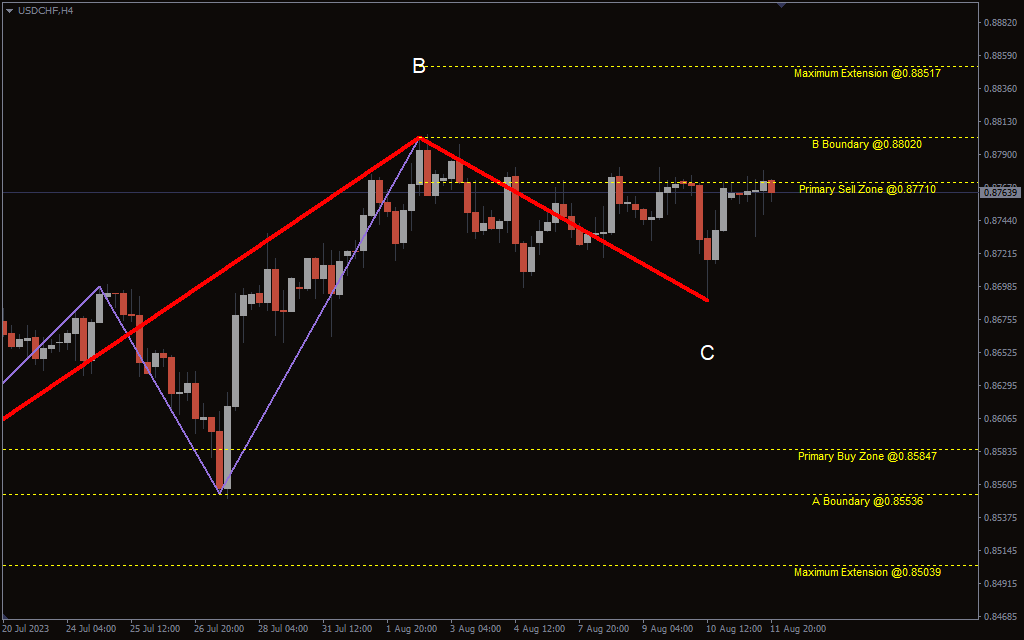
The USDCHF chart from the H4 timeframe shows the BUY/SELL signals of the indicator.
Look at the above chart! You can see a sell zone and a buy zone. You can place your limit orders around these levels. Once triggered, you can use the extreme levels as stop-loss. For take profit, you can use buy zone for the sell orders and sell zones for the by orders.
You can use the waves to protect your positions using the stop-loss around the levels. However, if you know the harmonic patterns, you can also use XABC to trade.
Conclusion
The Barrows Swing Indicator for MT4 is an automated tool that tells you the potential buy and sell zones. You can use these levels for entry, while you can use extreme levels as stop-loss.