

ADR Indicator
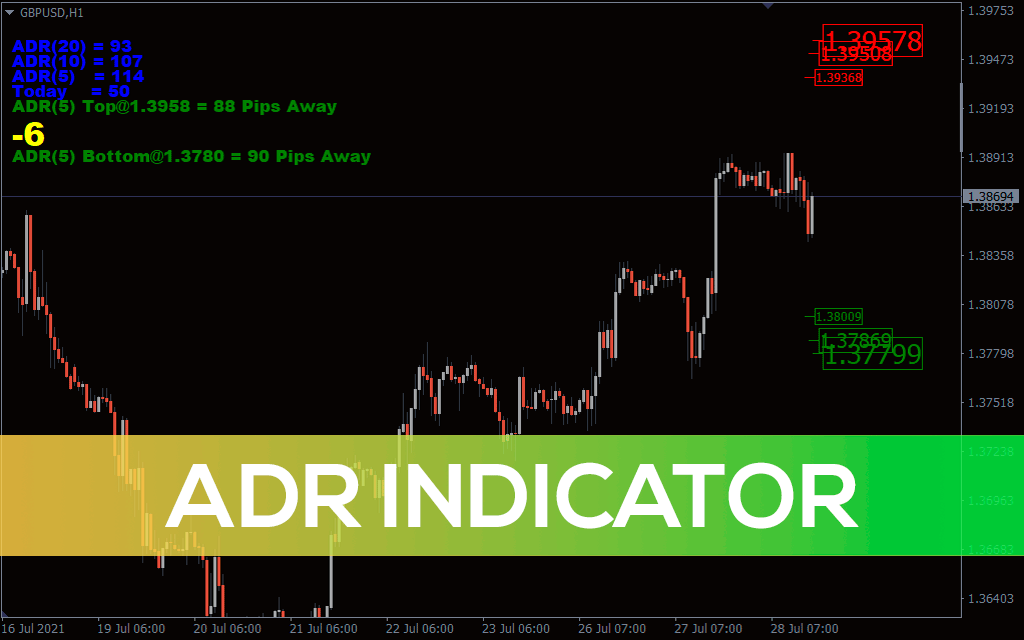
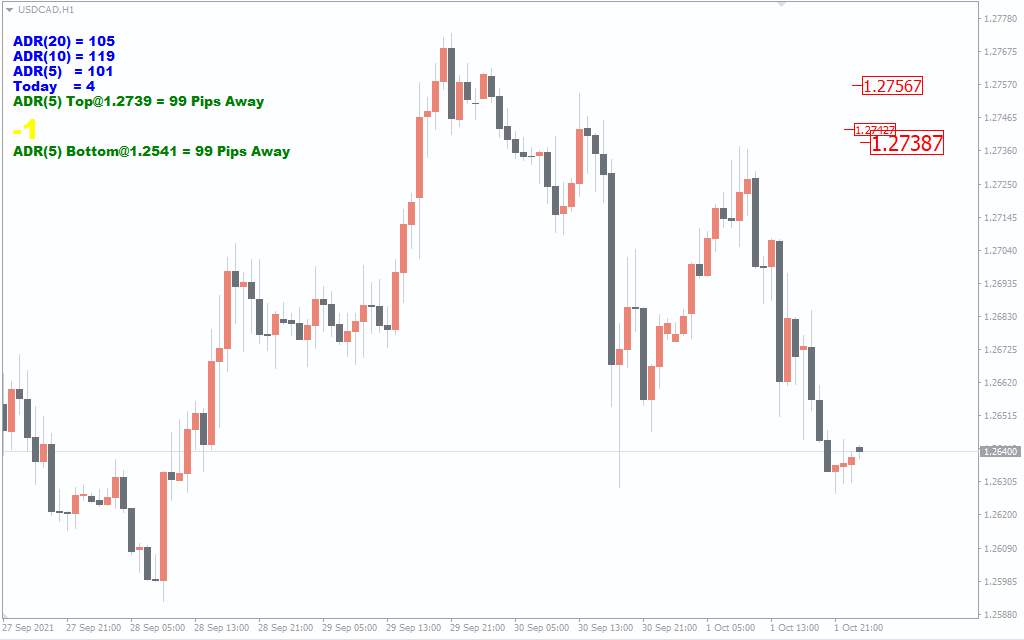
ADR indicator great tool for enhancing your trade exit strategy. Free Download. Shows the price range within a specified period and projected top and bottom points of the price.
Description
A lot of psychology goes into trading. For instance, you must be versed with resistance and support zones. Understanding these levels help set realistic take profit levels where the price is likely to reach within a specified period. Additionally, it helps you know when the price is likely to reverse. This is where the ADR indicator for MT4-Free download comes in handy.
How It Works
The Average Daily Range (ADR) indicator is designed to help you set realistic profit targets. It measures the price difference between the current price and extremes (top and bottom). In addition, it measures the average pips movement for a certain period, usually 20, 10 and 5 days. With this information, the trader can determine whether the profit target is realistic or not.
The indicator’s working is based on the average true range of the daily frame. Essentially, the 20 days Average Daily Range represents the 20-day ATR on a daily timeframe. The same case applied for the 5-day and 10-day ADR. Put differently, today’s Average Daily Range represents current day price movement range. This range is measured in pips.
Essentially, the indicator projects the top and bottom of the chart based on the 5-day ADR. The indicator predicts the top of the range by adding the 5-day ATR to the low of the current day price range. Similarly, it predicts the bottom using the high of the day’s price range minus the 5-day ATR. The indicator then measures the distance in pips between the current price and the projected tops and bottoms.
What’s more, the indicator measures the direction of price movement and labels them positive if the price movement is positive and negative for the negative direction. This information is displayed on the upper left side of the price chart.
How to Trade Using the Average Daily Range Indicator
The Average Daily Range indicator helps traders determine if their take profit is realistic. It also helps decide if there’s enough room in the direction of the trade. However, it does not provide reversal, trend or momentum signals. Therefore you should use it in combination with other strategies.
Long Position
Enter a buy position when your set profit point is within the projected top of the ATR indicator. For exit strategy, set your take profit below the projected top. An ideal stop loss should be below the entry point—several pips below the recent swing low act as a good stop loss.
Short Position
A good sell trade set-up has a take-profit above the projected bottom with the stop loss above the recent swing high.
Chart Example
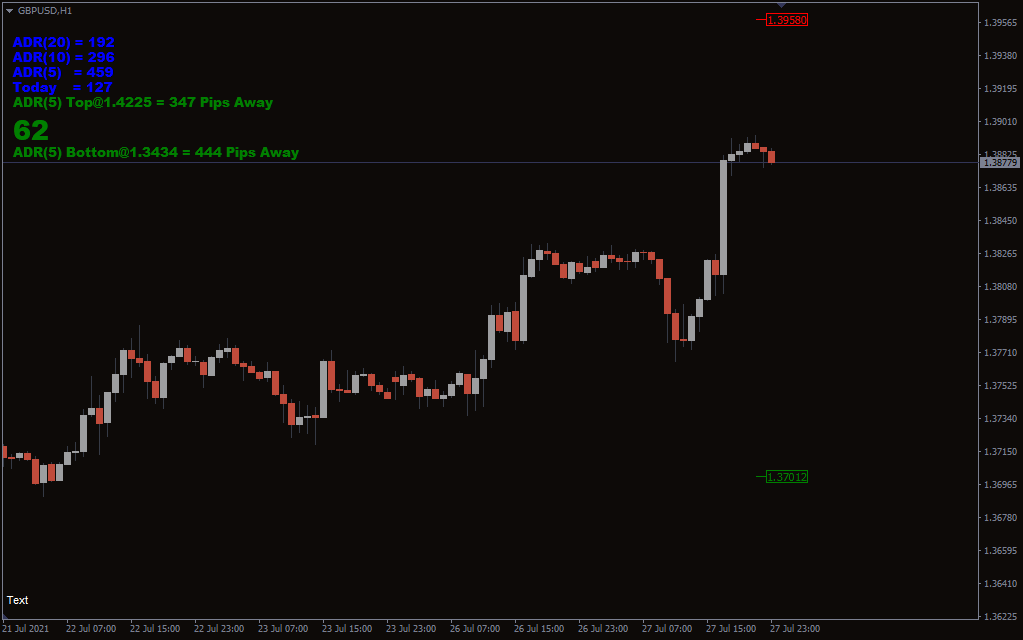
The pictures above show price movement for the Great Britain Pound against the U.S. dollar in a one-hour time frame. According to the indicator, the average range for the 20 days is 192 pips. Similarly, the 10 days ADR is 296 pips while the 5 days ADR is 459 pips.
According to the indicator, the current day price range is 127 pips. Similarly, the indicators show the price is 347 pips away from hitting the projected top and 444 pips from the bottom based on 5-day ATR.
Conclusion
The ADR is a great tool for planning trade and entry points. It helps you place realistic take profit targets and decide if the trade is worth the risk. Since the indicator does not offer to buy and sell signals, you should use it in conjunction with other indicators.