

4 Timeframe Heiken Ashi Indicator
Forex timeframes from the best 4 Timeframe Heiken Ashi Indicator for MT4. Identify the strength of the trend on multiple timeframes.
Description
The 4 Timeframe Heiken Ashi Indicator is a simple MT4 indicator that plots four timeframes on the chart.
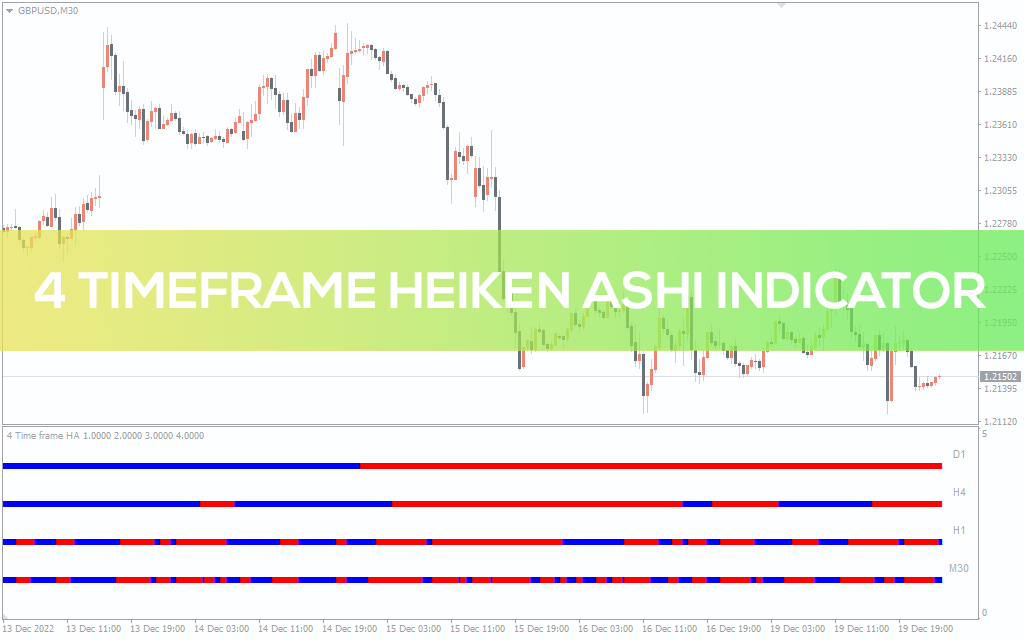
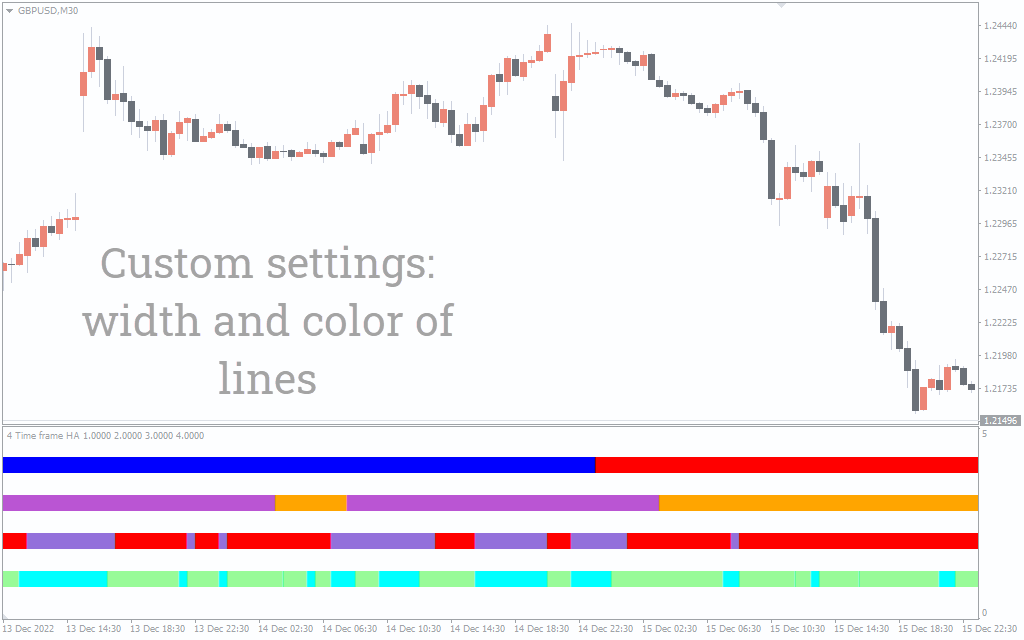
The indicator identifies the trend’s strength by plotting blue and red squares. Blue squares mark the uptrend, while red squares illustrate the downtrend.
Once you set this Indicator, it’ll automatically add higher timeframes, so you can use it for any strategy.
How to use the 4 Timeframe Heiken Ashi Indicator for MT4?
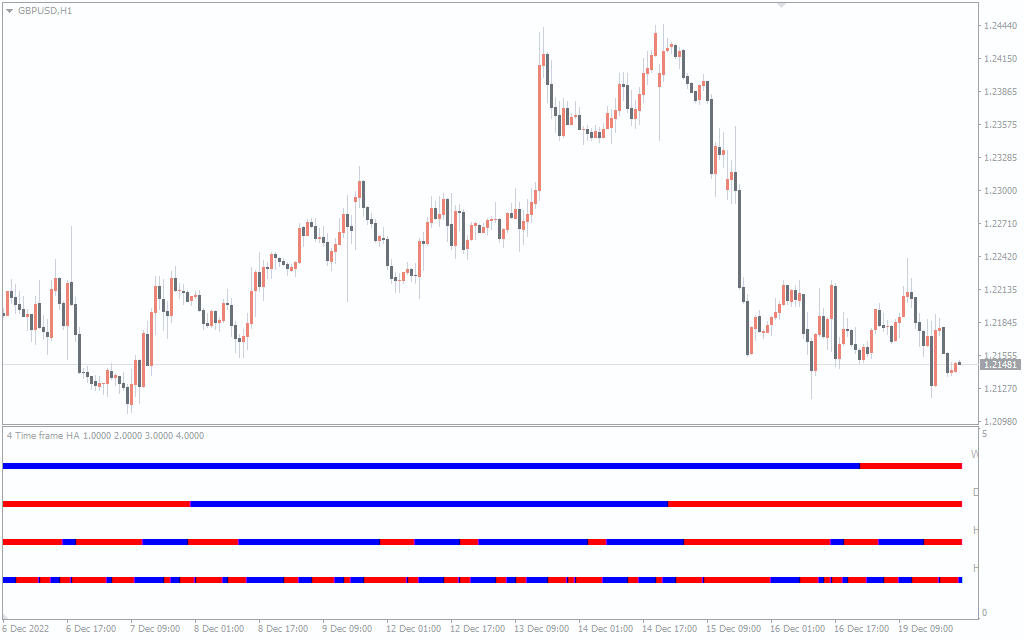
The above H1 GBPUSD chart shows the Indicator on the chart.
The indicator doesn’t tell BUY or SELL signals; rather, it tells about the trend’s direction on multiple timeframes.
The upper line of squares mentions the current timeframe. As we go down, the indicator marks trend strength on subsequent higher timeframes. For instance, if the current timeframe is 1H, the next line of squares will be H4, Daily, and Weekly.
You can use the indicator on any timeframe to tell the trend’s strength of subsequent timeframes.
To find the BUY and SELL signals, you can combine any other indicators like the RSI or MACD with this indicator.
Conclusion
The 4 Timeframe Heiken Ashi Indicator identifies trend strength by plotting multiple timeframes on the chart. The indicator tells the strength of the following timeframes.
If you want, you can download the indicator for free on our website.