Trend Trading Indicator
The Trend Trading Indicator represents the trend of an asset. The indicator is a robust tool for trading.
Description
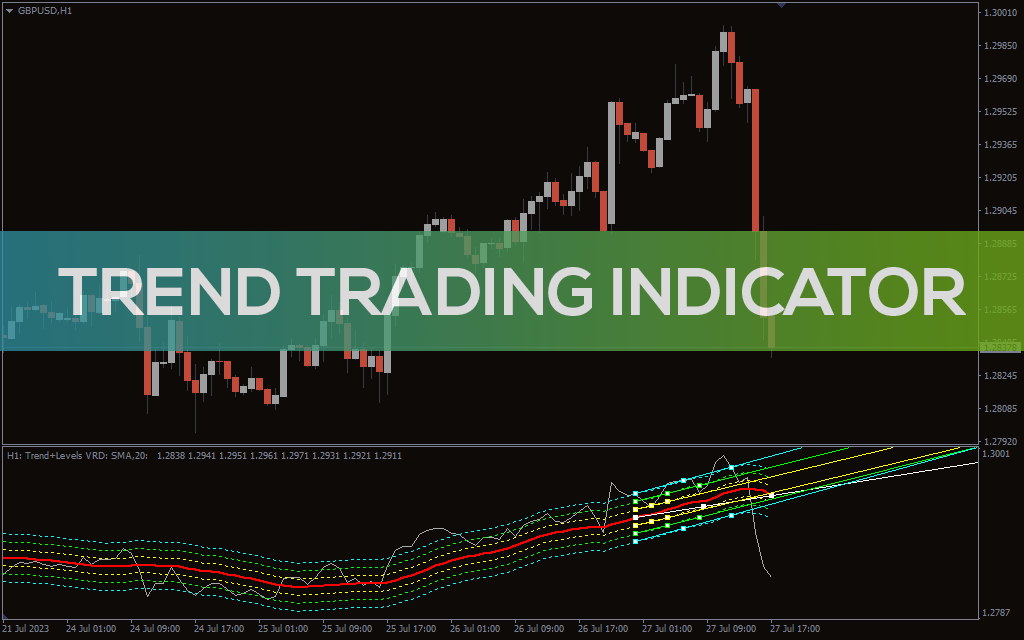
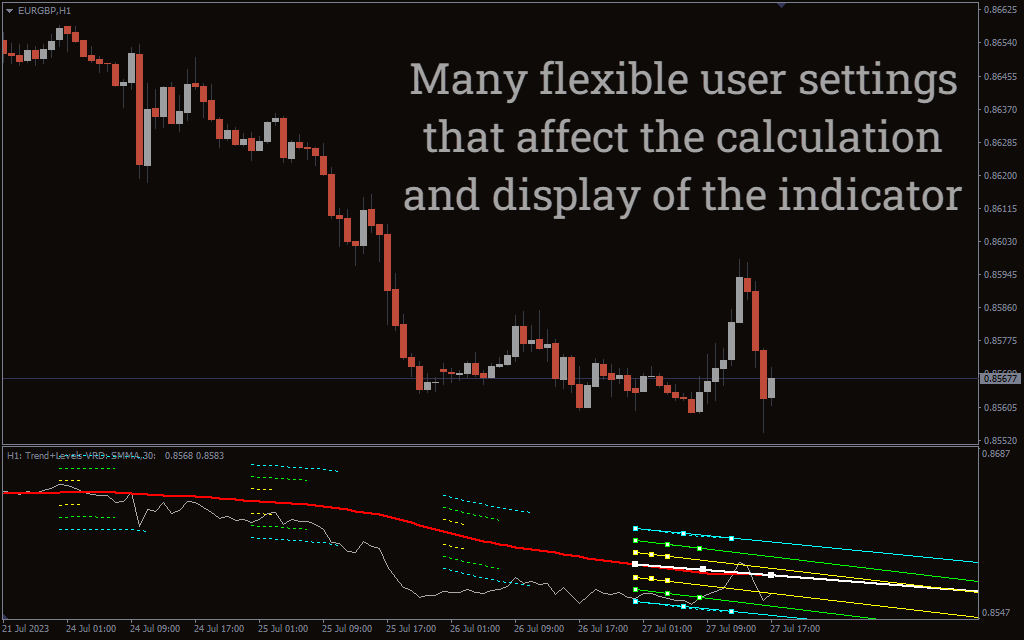
The Trend Trading Indicator appears in the data window with multiple lines representing the market’s primary trend along with the potential entry signals.
The indicator shows a red line, the 20-period SMA, while the grey line shows the asset’s price. Hence, it is like trading 20-SMA with a line chart.
You can use the tool at any timeframe. However, the probability increases when used on higher timeframes.
The indicator is a bit complex, and there can be more than one interpretation of the market. Therefore, pay attention to the following part of the article to grasp the optimal usage of this tool.
How to use the Trend Trading Indicator for MT4?
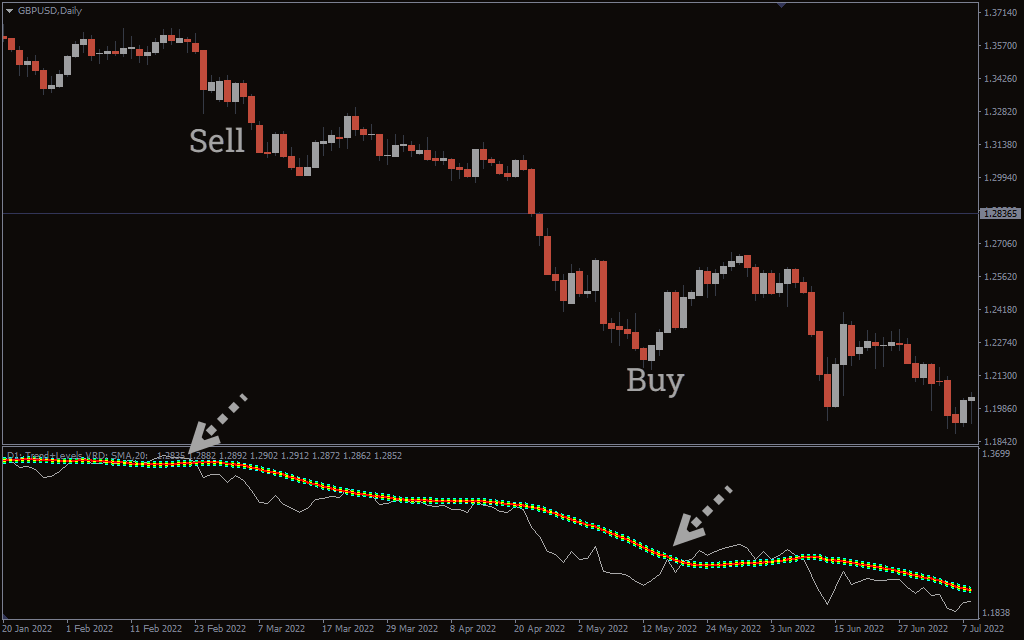
The GBPUSD chart from the D1 timeframe shows the BUY/SELL signals of the indicator.
Look at the data window! The thick line is 20-SMA, and its direction shows the market bias. You can use the indicator as a trend confirmation, or you can use it to trade as well.
You can enter the long position for trading when the grey line moves above the SMA. Similarly, you can enter a short position when the grey line falls below the SMA.
You can find many false reversal signals during a strong trend. You may also find false entries during consolidation when the grey price line wobbles around the SMA.
Therefore, you can use the indicator for continuation pattern trading during a strong trend. The price line may hit the SMA and bounce back. That’s your potential entry.
Conclusion
The Trend Trading Indicator for MT4 is based on the 20-SMA. You can play with periods and levels. However, the indicator is lagging, and the signals may appear when the market has already moved significantly.