TMA Centered Bands Indicator
TMA Centered Bands Indicator tells you the overall direction of the trend by plotting bands.
Description
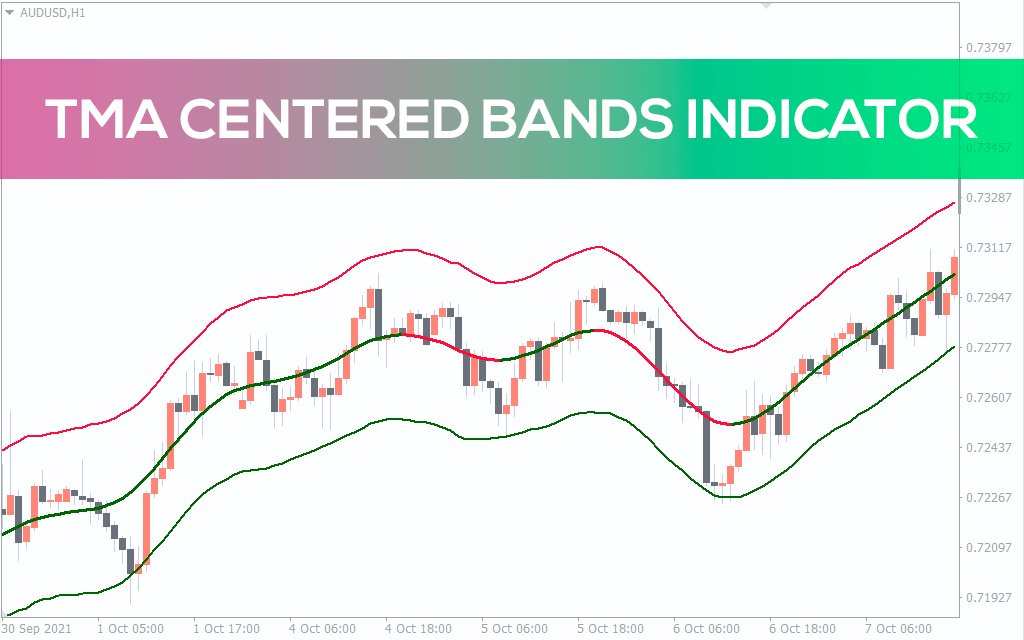
The TMA Centered Bands Indicator for MT4 draws bands on the chart and tells you the overall price trend. It plots three bands of red, green, and red-green color.
The top bands comprise red color, the lower band consists of red color, while the middle band depicts the red-green color.
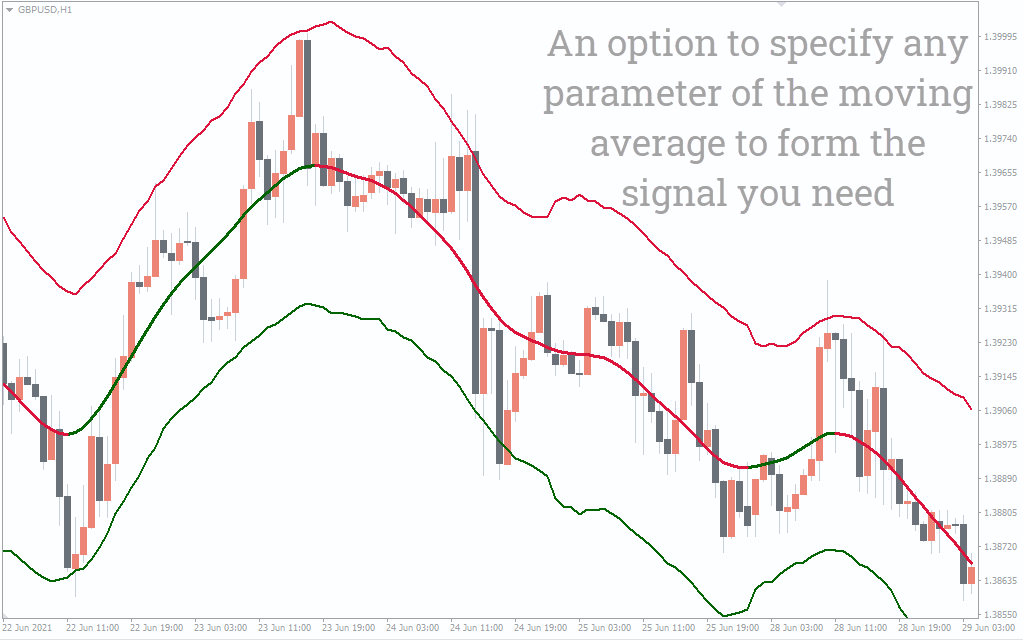
The bands are made up of moving averages, and each one of them has a MA period. The name TMA comes from triangular moving averages, as the indicator draws triangular bands.
The price will fluctuate between these bands whenever a trend changes its course, thus producing entry and exit points.
How to trade the TMA Centered Bands Indicator?
The TMA Centered Bands Indicator utilizes the power of moving average to plot bands on the chart.
Each band has different functionality. For example, when the price goes above the upper band, there is a chance that it’ll reverse. Similarly, when the price goes below the lower band, there’s a potential for a reversal. The middle band gauges the trend and turns green or red depending on the direction of the trend.
When the price goes above the upper band, you can take short positions. On the other hand, you can take long positions when the price slides below the lower band.
The middle band work as a mediator between the upper and the lower band. Whenever a trend changes its path, it turns red or green. Green is a signal of an uptrend, while red illustrates a downtrend.
TMA centered bands buy strategy
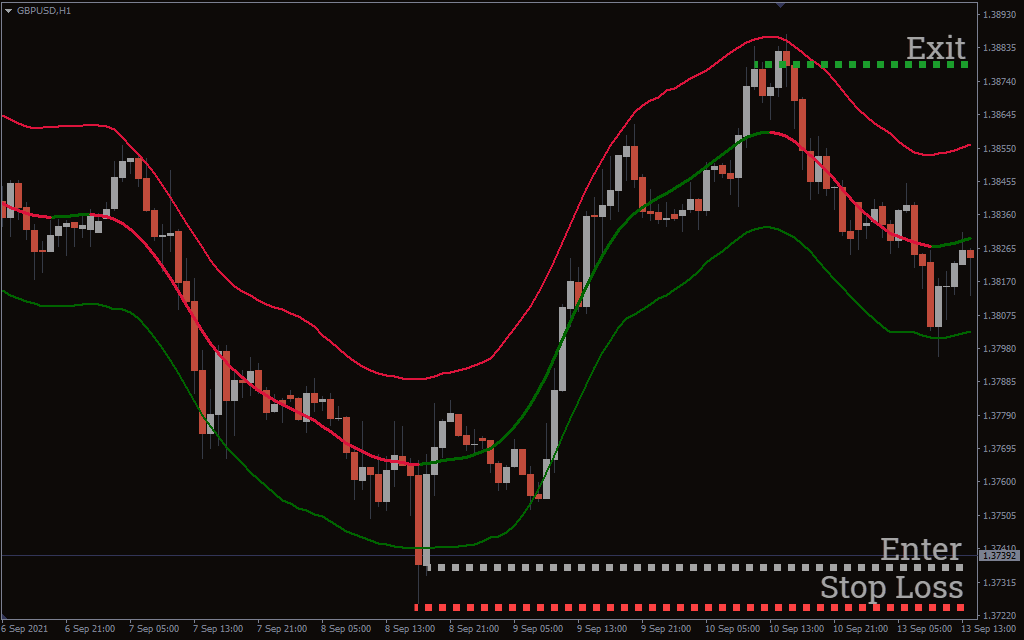
- The price should go below the lower band.
- Wait for the price trend to continue its route.
- Enter the long trade at the lower band.
- Place a stop-loss near the low of an entry point.
- Exit the trade when the middle band turns red.
TMA centered bands sell strategy
- The price should go above the upper band.
- Wait for the price trend to continue its route.
- Enter the short trade at the upper band.
- Place a stop-loss near the high of an entry point.
- Exit the trade when the middle band turns green.
Conclusion
The TMA Centered Bands Indicator works on every timeframe, so you can use it on all trading strategies. In addition, the indicator presents you with an overall picture of the direction of the trend.
As there is no holy-grail system, the possibility of loss does exist with the indicator.
You can also combine the TMA Centered Bands Indicator with confirmation indicators like moving averages or the RSI to further confirm the trend.