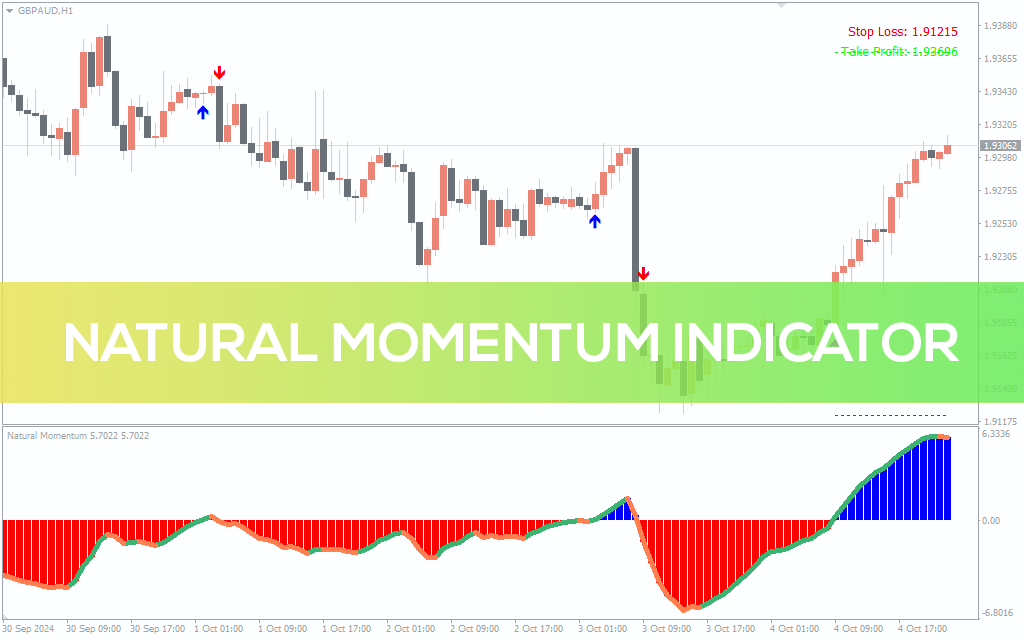
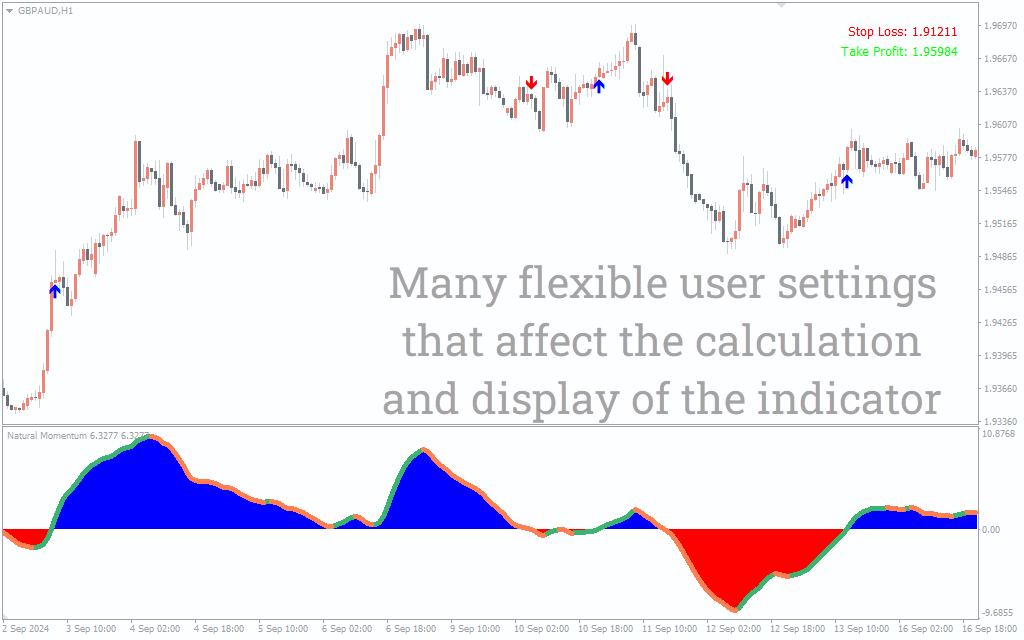
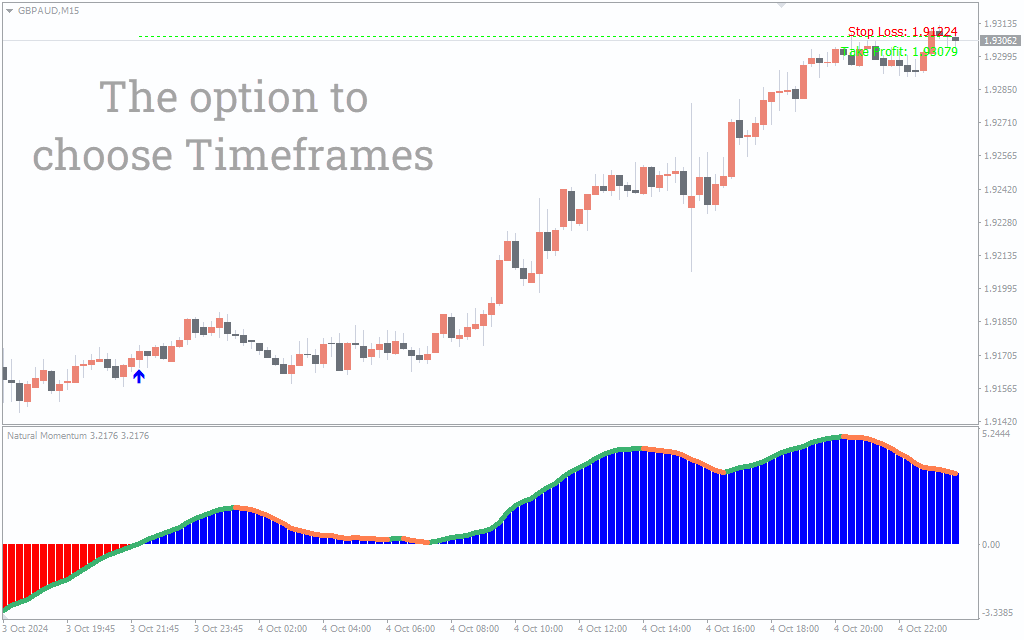
Natural Momentum Indicator
Discover the Volume at Price (VAP) indicator for MT4 – a powerful tool for analyzing volume-based price action with built-in pattern detection and customizable visual modes including VSA, PVA, Classic, and Delta.
Description
Volume on Forex is a powerful assistant and guide among the tangled market roads for many traders. But not everyone has enough knowledge and patience to analyze the volume on their charts in its classic, pure visual display.
But someone overcomes themselves and still tries to find something among the familiar columns of the volume chart in MT4, someone uses the well-known Better Volume 1.5 or Sonic PVA, and someone will like the new indicator Volume at Price, also known as VAP.
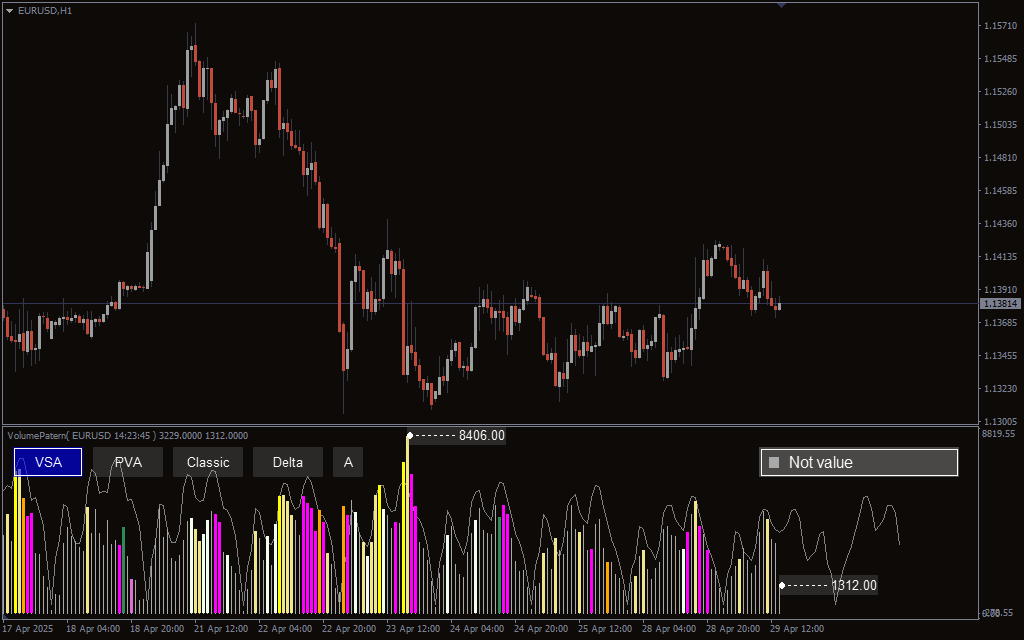
This indicator includes a wide array of built-in volume and price action patterns, such as:
- upthrust
- reverse upthrust
- pseudo upthrust
- pseudo reverse upthrust
- stopping volume high
- stopping volume low
- buying climax high
- selling climax low
- high churn
- no_supply_low
- no_demand_high
- strength_b
- weakness_b
- strength_a
- weakness_a
You can explore these patterns in more detail directly within the indicator. Our goal here is to highlight how the tool functions and what makes it useful.
The VAP indicator offers four distinct display modes: VSA, PVA, Classic, and Delta. By pressing the “A” button, users can activate pattern labeling directly on the price chart with corresponding color and name, allowing them to minimize the indicator window and free up space for chart analysis.
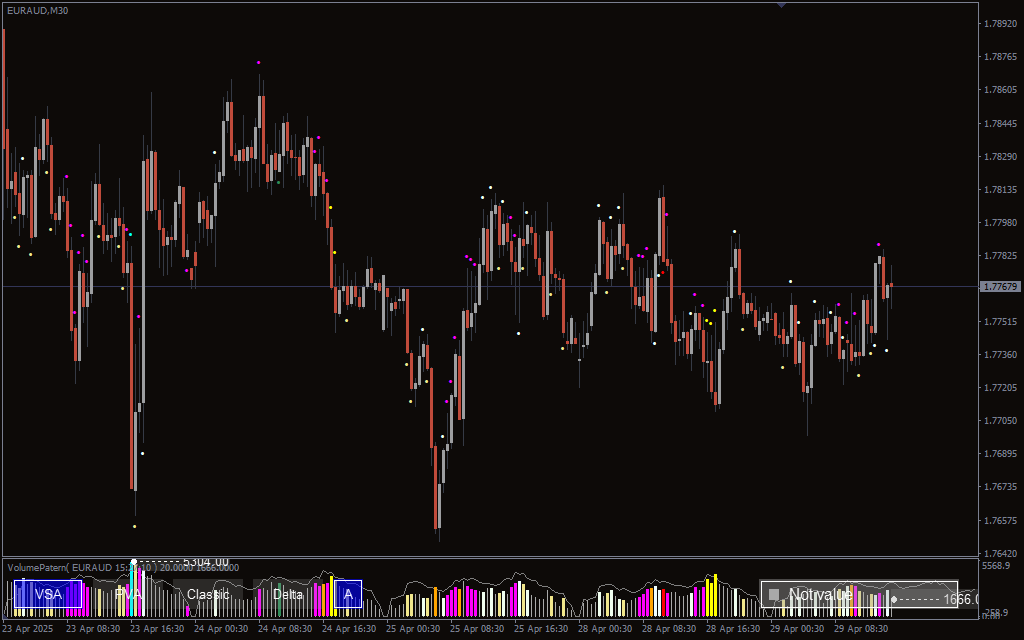
Additionally, you’ll see the name and color of each pattern in the upper-right corner of the indicator panel. If the label reads “Not value,” it means the current bar does not match any recognized price/volume pattern.
Another unique feature is the indicator’s ability to project anticipated volume levels for upcoming bars, based on historical volume behavior. This forecast is fully customizable in the settings, allowing users to fine-tune the display to their trading preferences.
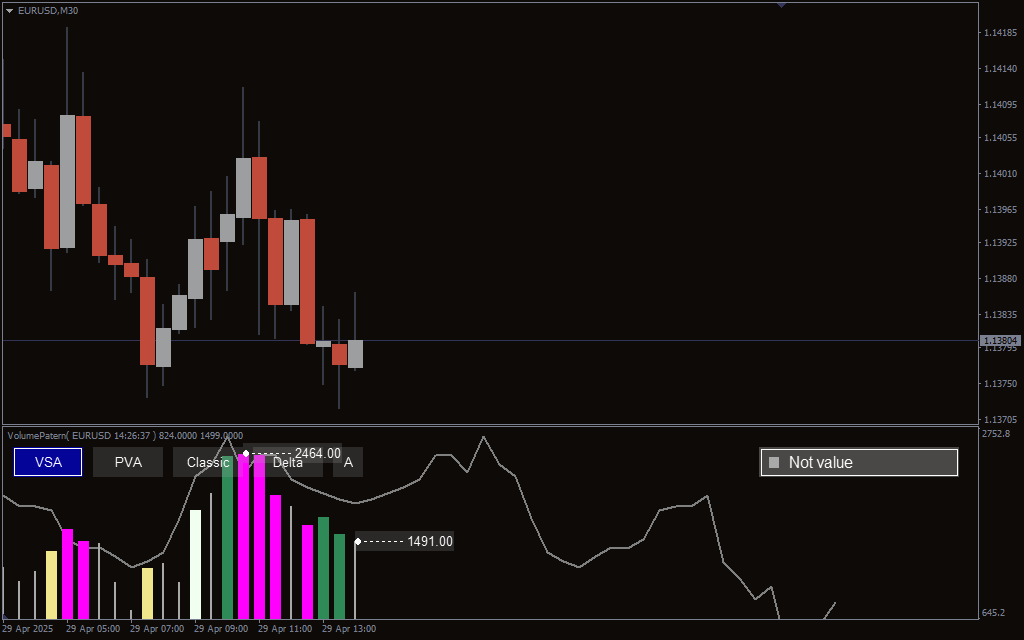
Volume at Price (VAP) Indicator Trading Signals
The VAP indicator doesn’t rely on classic buy/sell signals but rather highlights important price-volume interactions. When patterns like “buying climax” or “no supply” appear, traders can interpret these as potential signs of reversal, accumulation, or distribution. This pattern-based approach supports advanced volume spread analysis (VSA) and helps traders align their entries with market behavior instead of lagging signals.
Conclusion
Overall, the Volume at Price (VAP) indicator looks fresh and works very quickly, which is important for a modern trader. With multiple display modes, detailed pattern recognition, and projected volume capabilities, it offers an advanced yet user-friendly way to visualize volume dynamics. Whether you’re an experienced VSA analyst or just looking to add context to your price action analysis, VAP is a worthy addition to your trading arsenal.