
Levels of Resistance and Support Indicator
Determine accurate support/resistance levels on MTF charts of MT4 platforms. Suits all types of forex & stock trading strategy. Works in all market conditions.
Description
The Levels of Resistance and Support indicator determines solid event areas of the price chart. It closely monitors and collects the market’s daily high/low price data to outline solid S/R zones. This indicator helps traders quickly reveal the intraday support/resistance levels. Such key price zones can guide you through price breakouts, trend-following movements, and trend reversals.
In this tutorial, we’ll explain how to use the Indicator in MT4 to anticipate strong buy/sell signals in live markets.
How to trade using the Levels of Resistance and Support indicator for MT4
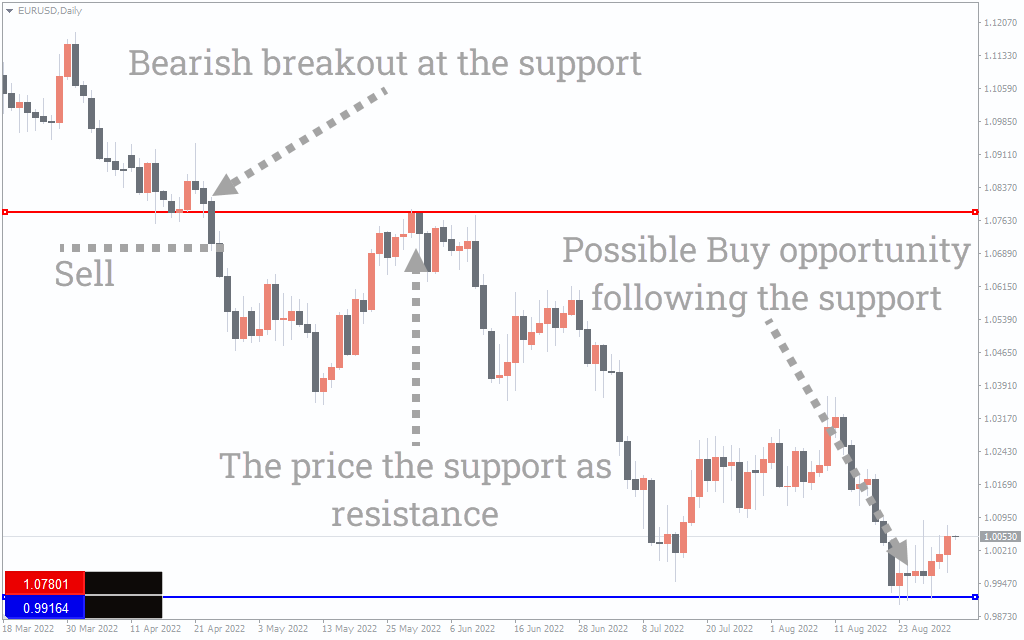
The Indicator plots an S/R generating button at the bottom-right of the main price chart. When you click the red button, the indicator will generate the current resistance level in red color. Contrarily, click on the blue button to reveal the intraday support. Closely monitor how the price behaves near the respective support/resistance zone. If the price exceeds a resistance, wait for the price candle to close outside the breakout level for further confirmation.
In the above chart, the price initially broke below the resistance while considering the level as support. Later, the price retested the same resistance level but rebounded downwards, treating the level as resistance.
Conclusion
The Levels of Resistance and Support indicator offers invaluable support for technical forex and stock traders in MT4. It works on MTF charts and suits all types of trading instruments available on the MetaTrader platform. It performs equally well for scalping and intraday trading. Try using moving averages and trend oscillators alongside the Indicator for better results.