i-HighLow Indicator
i-HighLow is the best MT5 indicator for tracking market highs and lows and predicting strong support/resistance levels. Suitable for any forex trading strategy
Description
The i-HighLow indicator continuously monitors price highs and lows for reliable breakout and swing trading signals.
It provides a detailed overview of recent price movements, highlighting the peaks and troughs of market ranges. In addition, you can identify key trendlines and trend channels by connecting highlighted price swing areas.
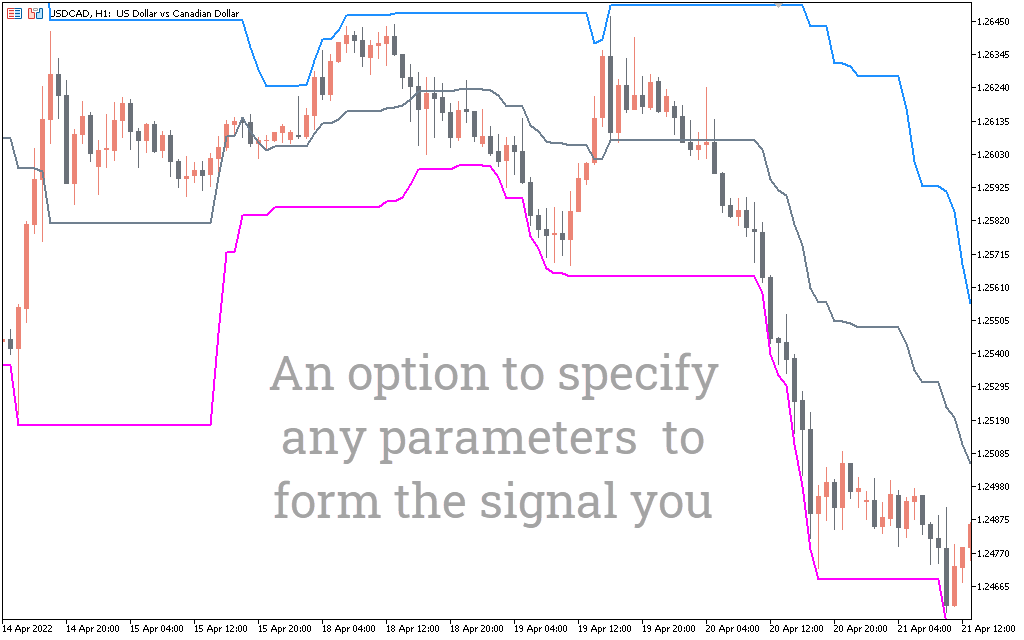
i-HighLow is an MTF technical analysis tool as it is suitable for all MT5 timeframes. What’s more, you can use it along with any forex trading strategy that requires high and low price analysis.
How to use the i-HighLow indicator to identify profitable buy/sell signals
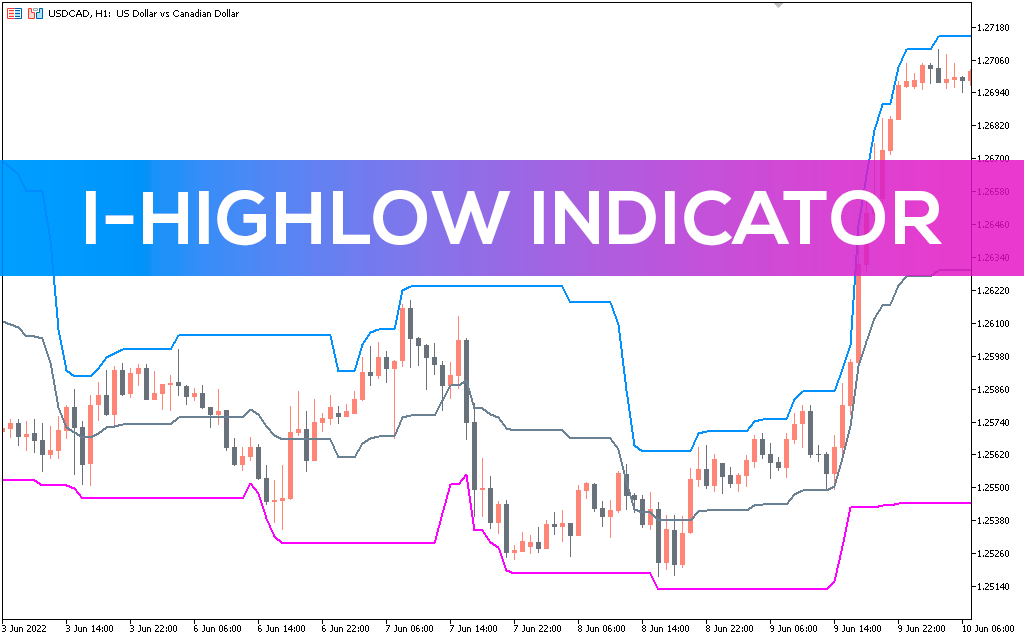
The upper and lower bands of the indicator connect the high and low of the market during each session of the timeframe specified in its MT5 settings. The middle band shows the average of the highs and lows of the price. So, when you apply it to MT5 charts, you get an idea of the maximum ranges of recent price movements.
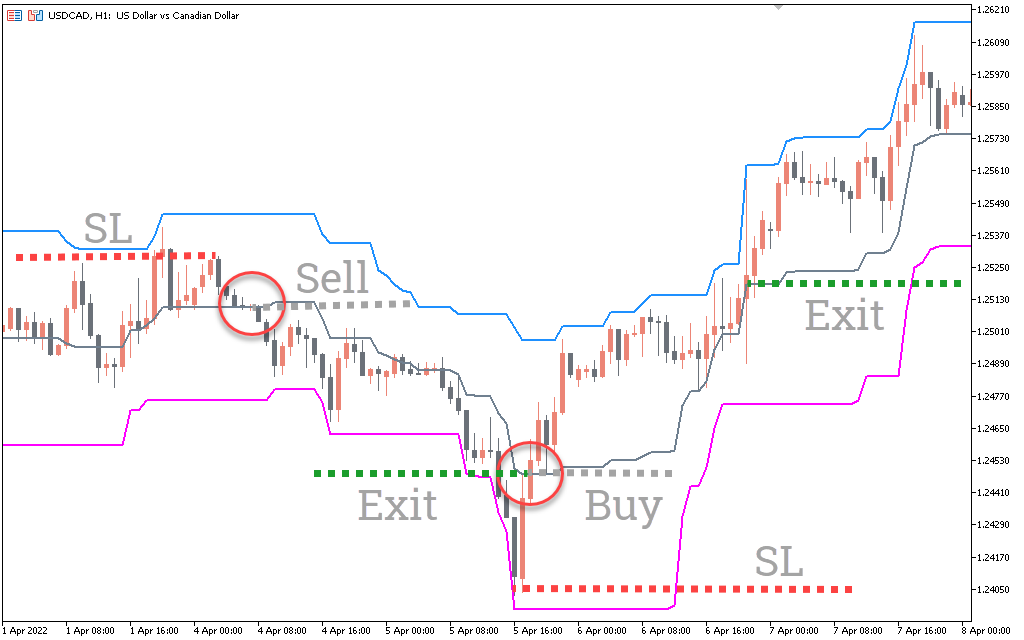
The example above shows how to identify trading opportunities at the high and low of the market using the i-HighLow indicator.
Initially, the price strongly rejects the market low as it builds a substantial bullish candle with a deeper shadow in the lower band. This suggests that the price is refusing further downward movement and intends to start a bullish growth from the corresponding support zone. Thus, we can activate a buy order on the break of the high of the bullish candle. You can add more positions to your current buy order or open a new long position when the price rejects a move below the middle band.
The area below the support zone is ideal for setting a stop loss to enter a long position. To enter a buy, make sure that the price refuses to move above the upper band, considering it as a resistance level.
Alternatively, you can enter a short position when the price reaches the upper band of the i-HighLow indicator. In this case, you need to make sure that the price rejects the market high and sees it as reliable resistance. For sell orders, place the SL limit above the resistance zone. In addition, you may consider a sell entry when the price shows a bullish reversal pattern on the lower HighLow band.
In an unfavorable situation, use the consolidation range outlined by the indicator as possible breakout levels. For example, you can go long when a recent market high is broken, or go short after the price breaks out of the current market low.
Conclusion
i-HighLow is a multifunctional technical indicator. You can use it in many ways to evaluate profitable forex trading signals. This indicator effectively identifies price reversal areas, especially during a range or trending market condition. During periods of consolidation, its upper and lower bands indicate critical price breakout levels. Although it does not entertain direct buy/sell signals, it offers exceptional support in your daily forex and stock price analysis.