Fisher Transform Indicator
The Fisher Transform Indicator finds overbought and oversold levels to identity key market reversals.
Description
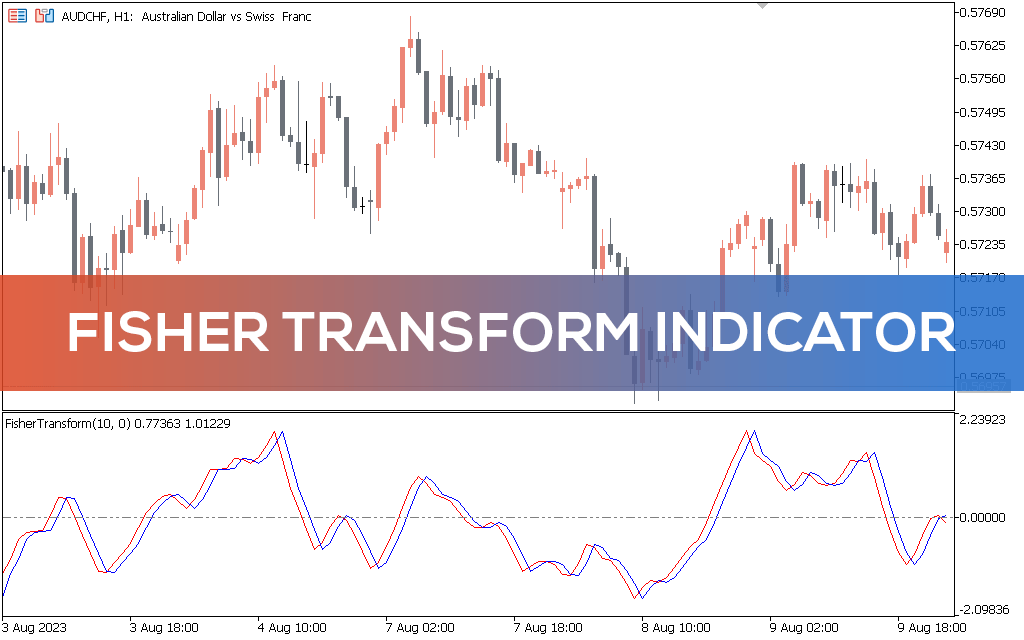
The Fisher Transform Indicator identifies potential reversals. The indicator, developed by J. F. Ehlers, is based on the assumption that prices do not follow a normal distribution and exhibit non-linear behavior.
The indicator is mainly used to identify overbought and oversold conditions in the market, which may indicate potential trend reversals.
It transforms price data into a Gaussian probability distribution, making it easier to spot extreme price movements.
The indicator starts by calculating the average price, which is the average of the high and low prices. It then measures the difference between the current average price and the previous average price. Tracking these differences over a certain period, he estimates the rate of price change.
The Fisher Transform indicator then normalizes the rate of change by summing the absolute differences between the current average price and the previous average price over the last N periods.
This normalization process helps to standardize the values and make them comparable across different timeframes. Thus, it aims to generate clearer and more reliable signals compared to traditional oscillators.
How to use the Fisher Transform Indicator for MT5?
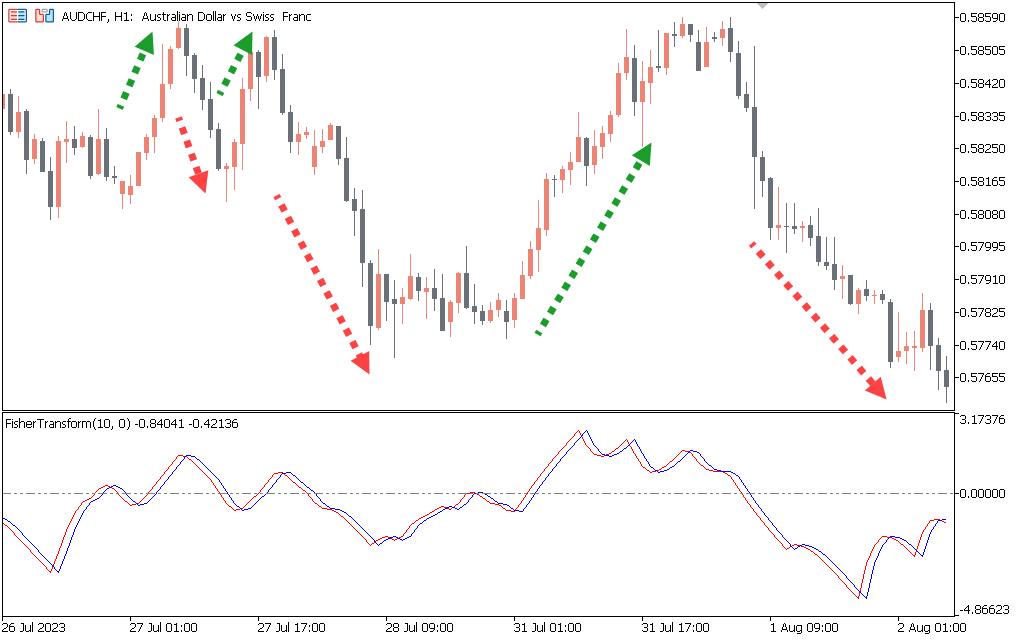
The AUD/CHF H1 chart above shows the indicator. The Fisher Transform Indicator gives values that range from -1.0 to +1.0. Readings above +0.5 indicate overbought, suggesting a downward reversal. Conversely, readings below -0.5 indicate oversold conditions suggesting a reversal to the upside.
Conclusion
The Fisher Transform Indicator for MT5 identifies potential market reversals. By transforming price data into a Gaussian probability distribution, it highlights extreme price fluctuations and helps identify turning points in a price trend.