
Weis Volume Indicator
The Weis volume indicator tells you about the direction of trends strength.
Description
David Weis, a market analyst, developed the Weis indicator. In his book “Trades About to Happen: A Wyckoff Method,” he discussed price and volume waves in various markets.
He suggested that price and volume travel in waves rather than equal proportions.
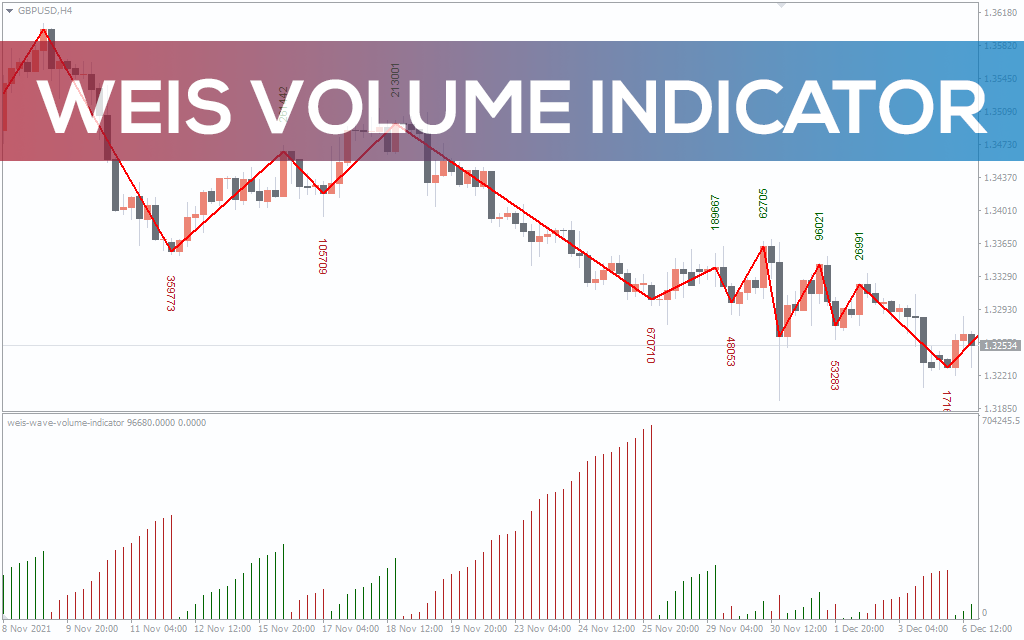
The Weis Volume indicator tells you about the trend’s direction and overall strength. The indicator comprises a wave and several bars at the bottom.
If you’re interested in similar tools for volume-based decision-making, be sure to check out our Better Volume New Alerts Indicator and Volume Divergence Indicator as well. Both pair excellently with the Weis method and can help confirm your volume analysis with unique visual cues.
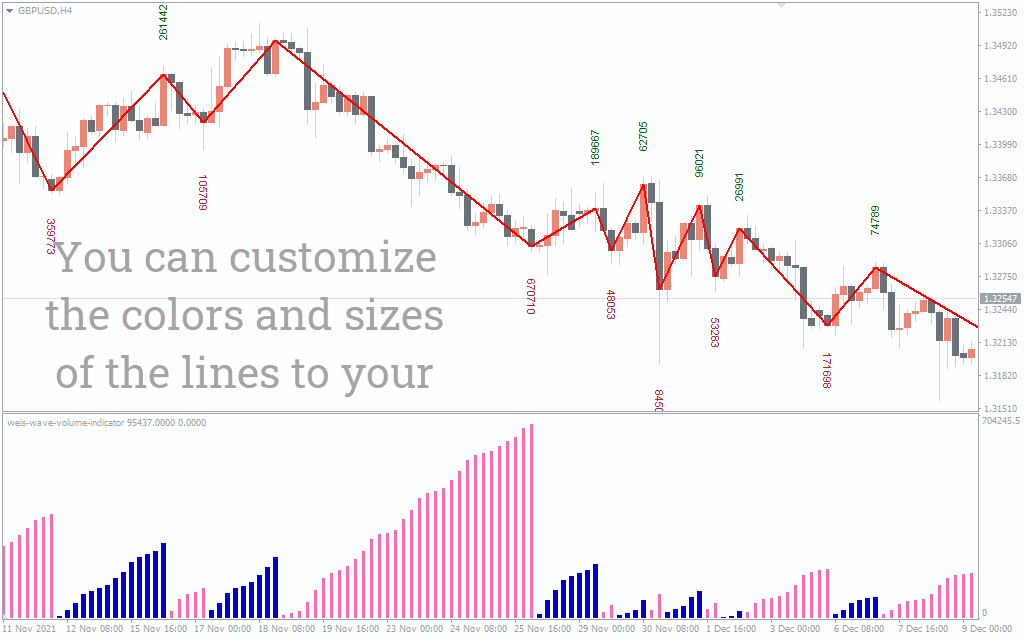
The wave paints the direction of the trend, while bars indicate the volume. Like any other volume indicator, the bars reflect a bullish and bearish trend.
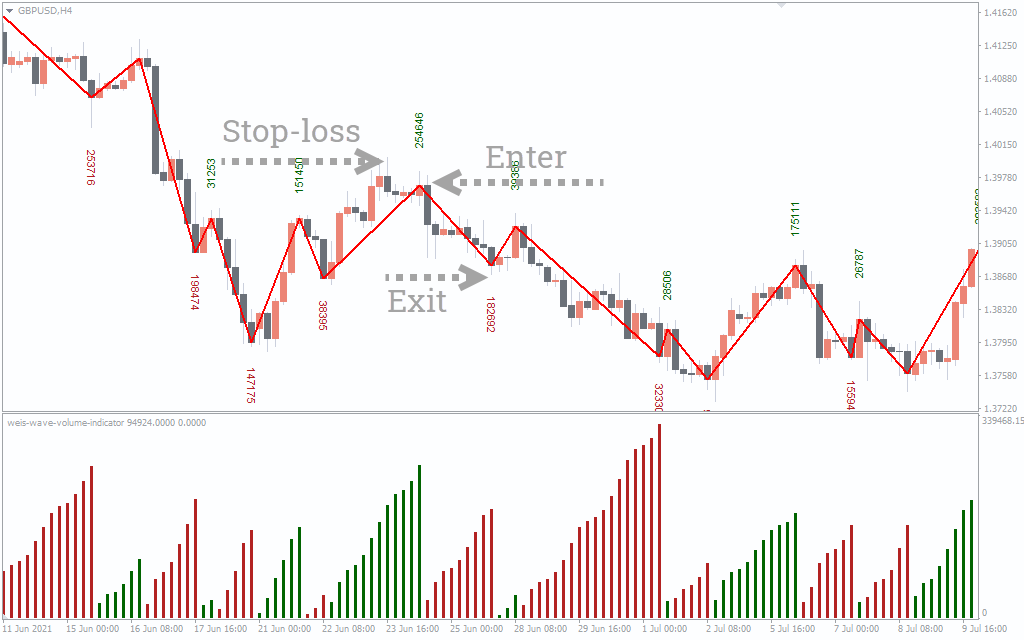
When the Weis indicator plots red bars, it’s a bearish trend. On the flip side, it’s a bullish trend when the indicator draws green bars.
The indicator also illustrates numbers on the chart. These numbers suggest the volume of the bar. When the volume is low, it repaints a smaller number, while it plots a high number when the volume is high.
Personally, I found the installation and setup of the Weis Volume Indicator straightforward. Once I added it to my chart in MT4, the color-coded waves and volume bars immediately provided clarity. What stood out to me was how intuitive the numeric volume display was — it allowed me to quickly spot weakening or strengthening pressure without second-guessing. This was particularly useful during sideways markets, where volume shifts are subtle but crucial.
How to trade the Weis Volume indicator?
As a volume indicator, Weis works on the concept of supply and demand.
When the supply is high, the indicator draws green bars, and the wave is trending upwards.
Conversely, Weis pops up red bars when the demand is high and the wave is trending downwards.
The core concept of trading with Weis is volume. When the volume is high, this is the time to enter the trades. When the indicator mentions low volume, it’s time to exit the trade.
The wave structure presents good entry and exit points. When the wave dips, it defines a good buying point, and when the indicator’s wave goes above, it’s a good selling point.
A key point to add here is to enter when the bars change their color. This is because the Weis indicator is prone to false signals. So, it’s best to avoid the market noise.
Let’s find out the buy and sell strategy for the indicator:
Weis Volume indicator buy strategy
- Weis indicator should show a high volume.
- Wait for the wave to move upwards.
- Enter the trade at the green bar.
- Put a stop-loss near the low of a buying point.
- Exit the trade when the bar changes color.

Weis Volume indicator sell strategy
- Weis indicator should show a high volume.
- Wait for the wave to move downwards.
- Enter the trade at the red bar.
- Place a stop-loss near the high of a selling point.
- Leave the trade when the bar changes color.
Pros and Cons of the Weis Volume Indicator
 Pros
Pros
- Clearly shows bullish/bearish pressure via color-coded bars.
- Numbers provide real-time volume insight.
- Works across all timeframes.
- Easy to interpret for Wyckoff-style trading.
- Pairs well with RSI, MACD, or divergence tools.
 Cons
Cons
- May produce false signals during low-volume periods.
- Requires basic knowledge of volume-based trading.
- Doesn’t provide explicit buy/sell alerts.
- Some traders may find the numeric overlays cluttered.
Conclusion
The Weis Volume indicator works best on every timeframe, but it produces less false signals on longer timeframes. For more accurate trading signals, you can combine the indicator with others like the RSI or MACD.
From my own use, I found the indicator particularly helpful on H1 and H4 charts where volume spikes are more meaningful. It’s not a “set and forget” tool, but if you observe wave structure and volume in tandem, it becomes a powerful companion for swing or trend-based strategies.
Frequently Asked Questions (FAQ)
 Does Weis Volume Indicator repaint previous bars?
No, the volume bars and wave direction remain stable once printed. However, volume numbers update live with new ticks.
 What timeframes work best?
While it can be used on any timeframe, I personally find it most reliable on H1 and above, where volume data is less noisy.
 Can I use it for scalping strategies?
Yes, the Weis Volume Indicator can be helpful for scalping when used on lower timeframes like M1 or M5. However, due to potential noise, it’s recommended to combine it with fast-moving averages or momentum indicators.
 Is it beginner-friendly