

Volume Average Indicator
An excellent assistant in the analysis of forex volumes. Volume Average indicator contains MA volumes and alerts! Compatible with all markets. It doesn’t repaint. Read how you can use this indicator for Forex trading.
Description
Volume Average is a very simple forex indicator for analyzing volumes.
When added to a chart in Metatrader 5, the indicator displays a volume histogram in different colors, as well as a moving average (MA Volume).
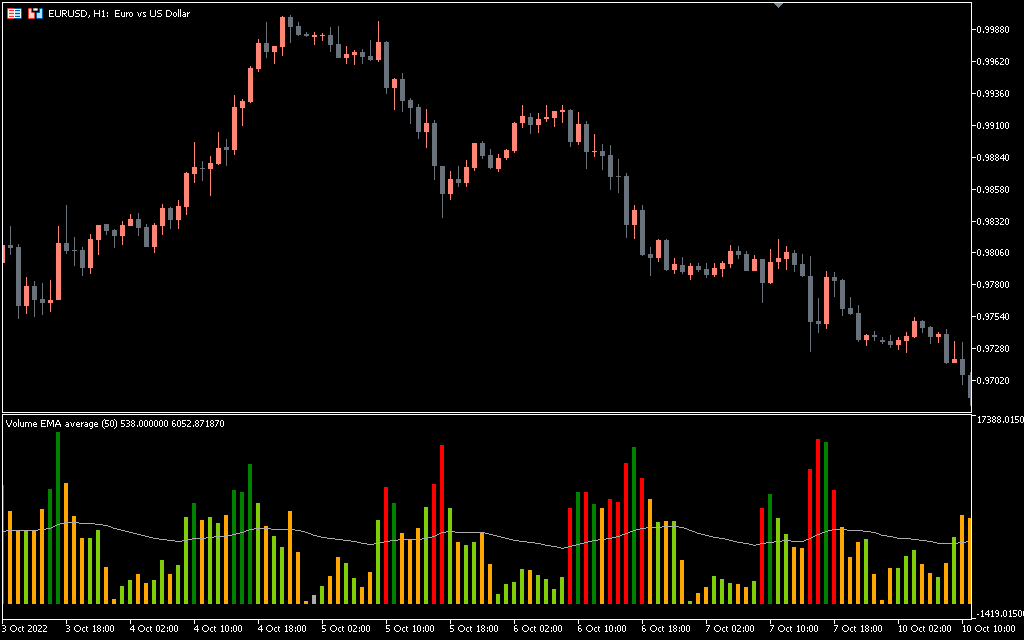
- Light green bars on the volume histogram are displayed when the price rises, and the fast MA Volume < slow volume MA.
- Bright green bars are displayed when the price is going up and fast MA Volume > slow volume MA.
- The yellow bars are displayed when the price is going down and the fast MA Volume < slow volume MA.
- Bright red bars are displayed when the price goes down, and the fast MA Volume > slow volume MA.
What is MA Volume indicator?
This is a traditional moving average, but it is not calculated based on price values, but on volume values.
How to add an average value to the volume indicator?
In Metatrader 5, there may be problems with adding the MA to the volume indicator, the standard features do not allow it. The chart below shows that the classic volume indicator (bottom panel) does not have an average value.
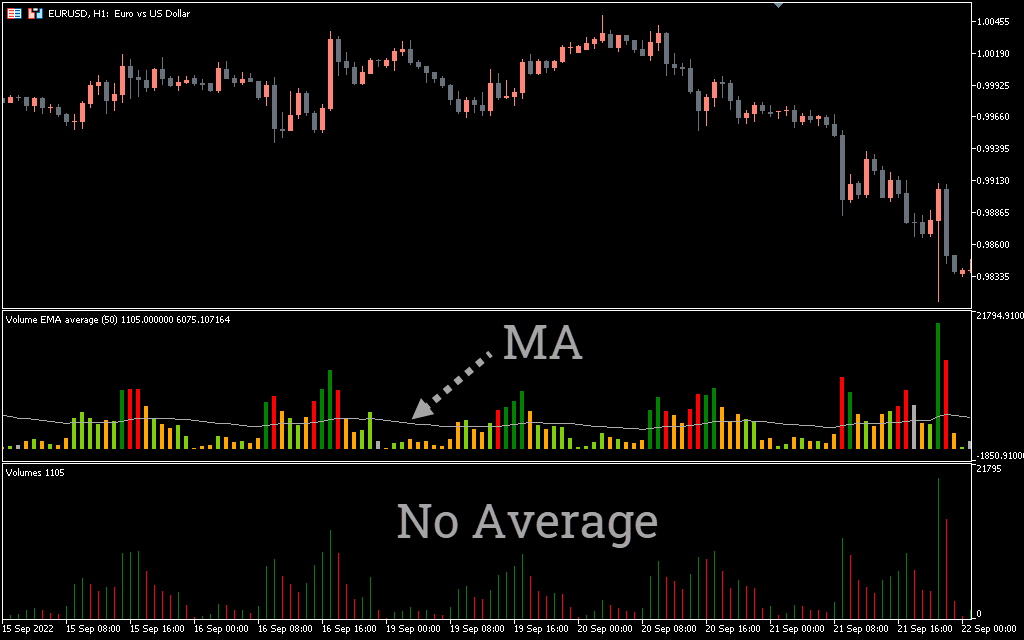
Fortunately, there is a Volume Average indicator. It may be the best for this purpose because it already contains a moving average.
How to use the indicator for trading
The Volume Average indicator does not give simple buy and sell signals with arrows, as novice forex traders would like.
This tool serves as an assistant for traders using volume analysis, a large section of technical analysis.
Buy signals
The example below (USDJPY, M30 forex chart) shows how volume analysis helps a trader come to the conclusion about opening a long position.
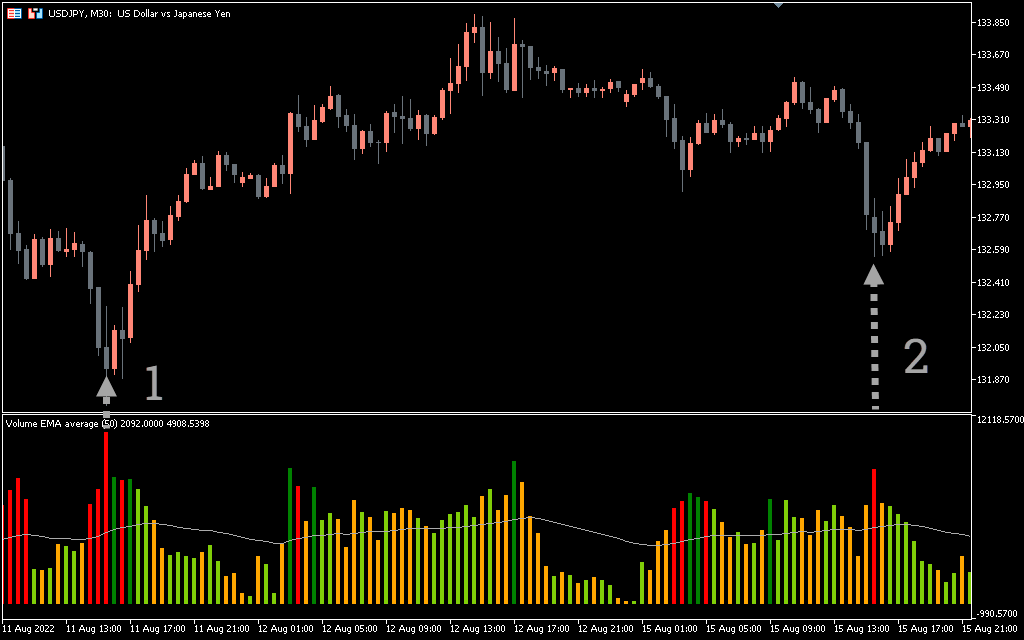
Volume analysis is closely related to the interpretation of the activities of large players who are able to change Forex prices with huge volumes of their orders.
Arrows 1 and 2 point to bearish candles, but the bodies of which narrow on high volumes. They may indicate that large players are using falling prices to accumulate large long positions. Therefore, prices slow down and then turn up.
This should give the impression that the majors are bracing for a significant bull market, so trading up would be the smart move.
Sell Signal
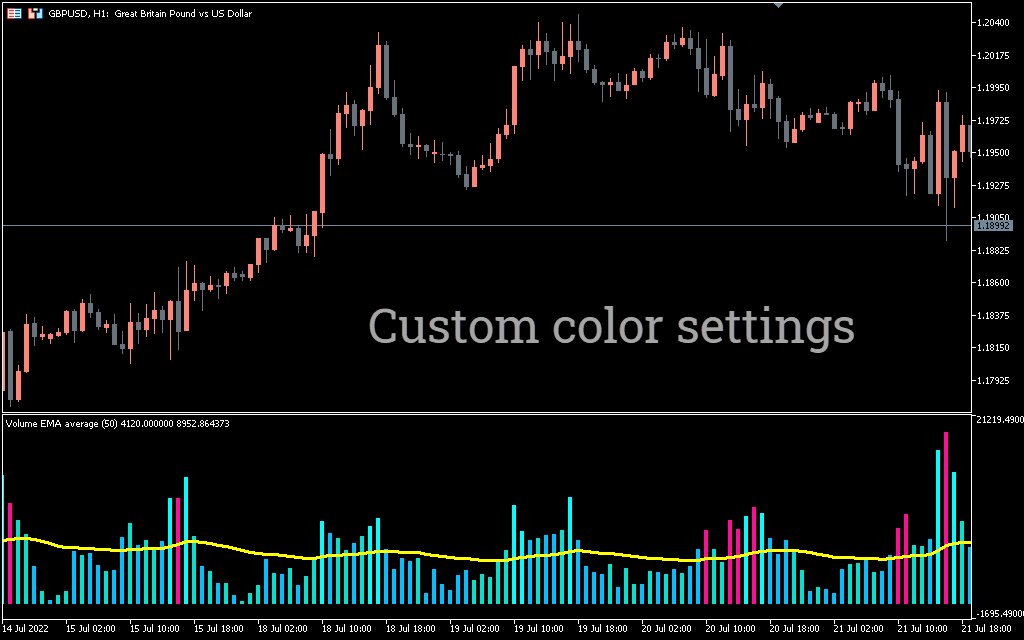
Here is a simple example (GBPUSD Forex hourly chart – below) of how volume analysis can lead a trader to go short.
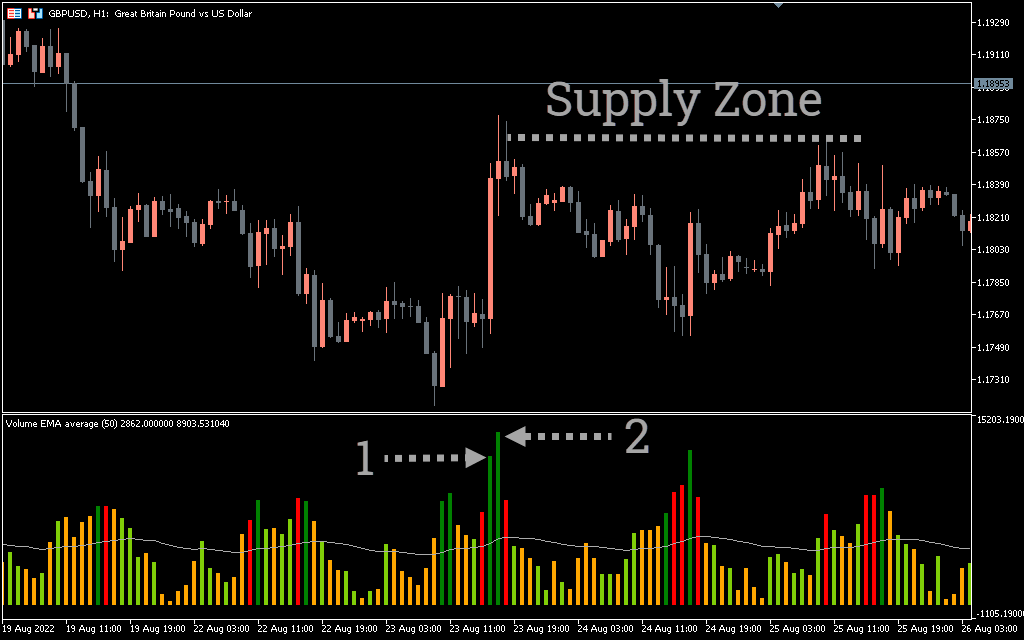
Bar number 1 corresponds to a sharp increase in prices on high volumes – it looks like the volume of demand has sharply exceeded the volume of supply.
However, on bar No. 2, the growth slowed down sharply, although the volume increased. This may mean that a large amount of supply has entered the market.
Build a supply zone using the high and close of this candle, and then wait for the price to rise to test this zone. Then you can get a bearish reversal setup or a false bullish breakout.
Conclusion
The Volume Average Indicator for Metatrader 5 provides more convenience in such a complex task as volume analysis.
Benefits of the indicator:
- Non-repaint.
- It provides Simple settings.
- Applicable for intraday trading, as well as for opening investment positions on daily/weekly/monthly charts.
- Applicable to any market: forex, stocks, etc.
Disadvantages of the indicator:
- It does not give buy or sell signals. The indicator simply helps to analyze volumes, and for this you need to make a lot of effort in theory and practice.
To use the Volume Average indicator for MT5, read volume analysis books – this method is closely related to the law of supply and demand and the interpretation of the actions of large players.
Download the Volume Average indicator for MT5 for free now!