TRIX.Crossover Indicator
The indicator shows trend entry points with a triple exponential moving average. The possibilities of the indicator combined with various settings will help you use it effectively in your trading strategy in the forex market.
Description
Some indicators in the MT4 terminal, unfortunately, are not always useful enough in their application. This is often due to the fact that the default indicators are unable to analyze the forex market 100%. That is why the TRIX.Crossover (“Trix”) moving averages indicator was created. It is an updated version of the Moving Average trend indicator.
Indicator TRIX.Crossover Description
The “Trix” indicator automatically builds a triple exponential moving average in the MT4 terminal chart. It is also called TEMA (Triple Exponential Moving Average).
You most likely know that the chance of making a profitable trade during an active trend phase in the forex market is higher. This is because the trend implies a strong price movement in one direction.
The opposite phase of the forex market is a flat. It is a less suitable phase of the market for the directed trade. But it all depends on the size of a flat. It is often unsafe to open deals during a narrow flat, because of low liquidity.
The indicator is designed to distinguish a trend from a flat. “Trix” solves this problem with the help of various options. They sift market noise and false entry points accurately enough.
“Trix” can be a good addition to your trading strategy. It is because the filters of the indicator, together with automatically generated signals, increase the chance of a positive result of a deal.
Indicator features
The basis of the indicator is standard moving averages, provided in the MT4 terminal by the Moving Average indicator. Compared to them, the TRIX.Crossover indicator has a number of advantages.
The indicator is not plotted in the chart, but in a separate window. This is convenient because the price is not cluttered with indicator information.
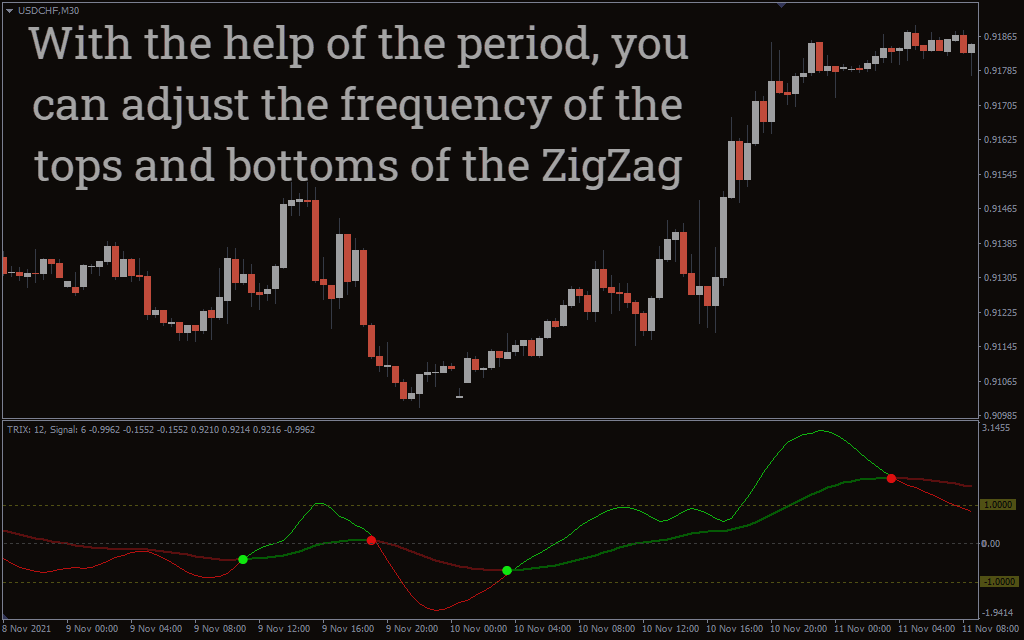
Indicator signals generate two moving averages – fast (signal) and slow (main). When the fast one crosses the slow one, the indicator generates a signal for trade. Such moments are marked with dots. The lower you have specified the period of the fast moving average in the indicator settings, the more often you will get recommendations for opening trades. And vice versa.
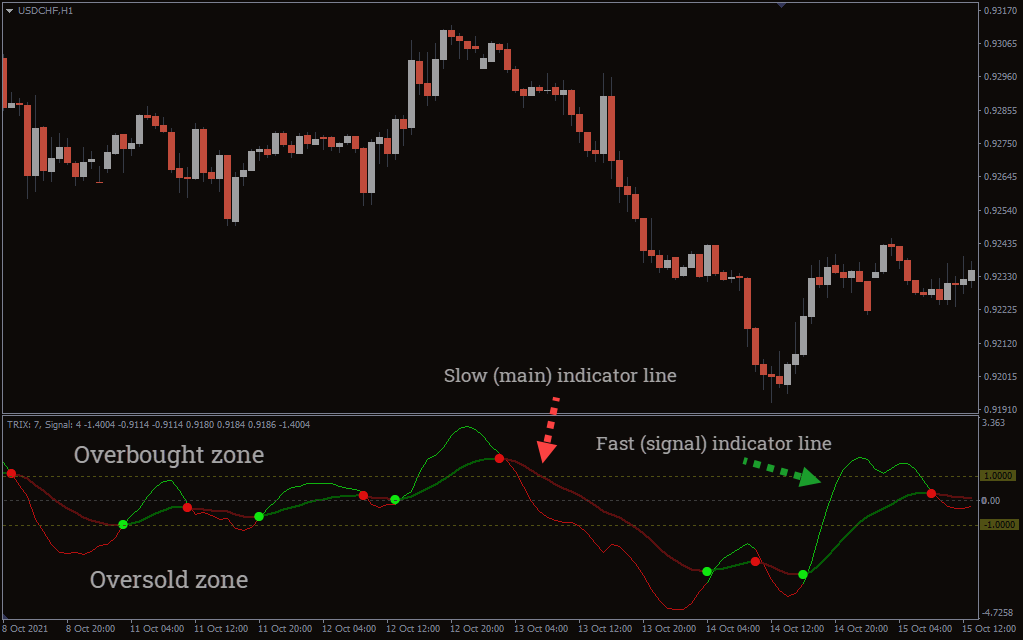
In the indicator window, by default, a horizontal line with the value “0” is drawn. The whole area above it is considered an overbought zone, and below it – an oversold zone.
The higher the moving averages are from zero, the stronger the overbought area is. Therefore the downward reversal is more probable. The opposite is also true when the indicator lines are below zero.
The indicator uses only market price data to construct a triple exponential moving average.
How to trade using the TRIX.Crossover indicator
We recommend using the “Trix” indicator as an additional instrument to the basic trading strategy. It can also be used in combination with other indicators of the forex market. In fact, the more factors indicate the position opening, the higher is the reliability of the signal.
As an additional indicator, let us refer to one of the most popular methods of technical analysis of the forex market. This is the Support and Resistance levels and the free SupportAndResistance indicator.
To illustrate the use of the indicator, let us consider those situations in which it is usually the most effective. It is in a clearly defined trend.
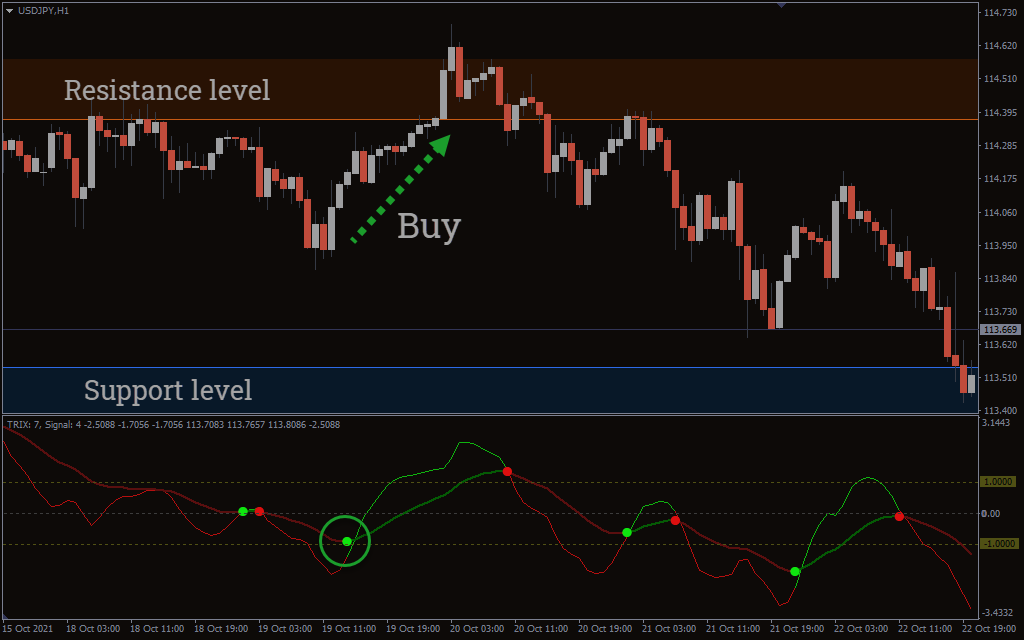
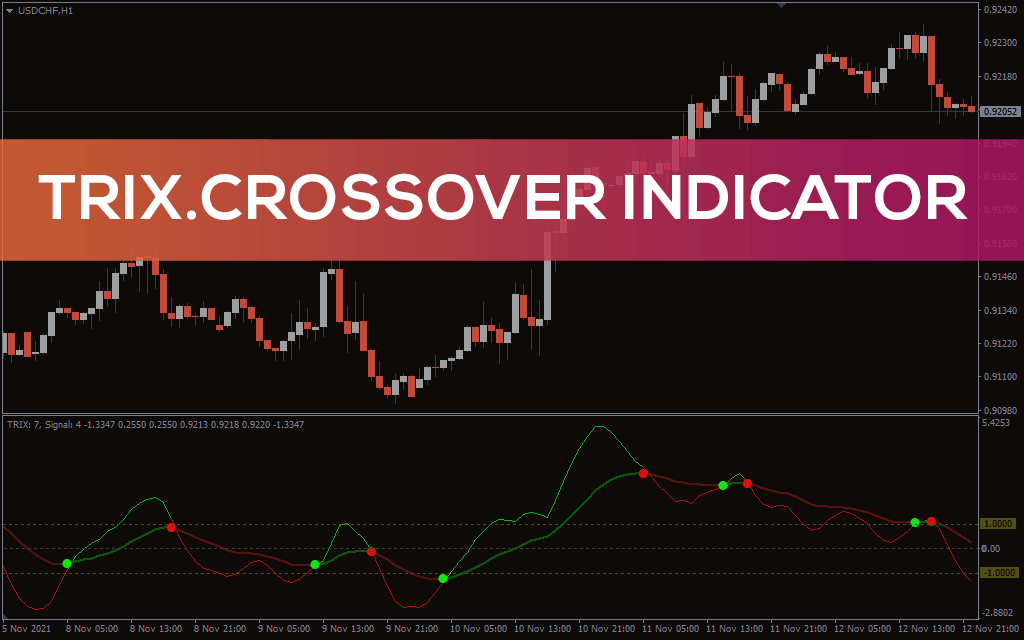
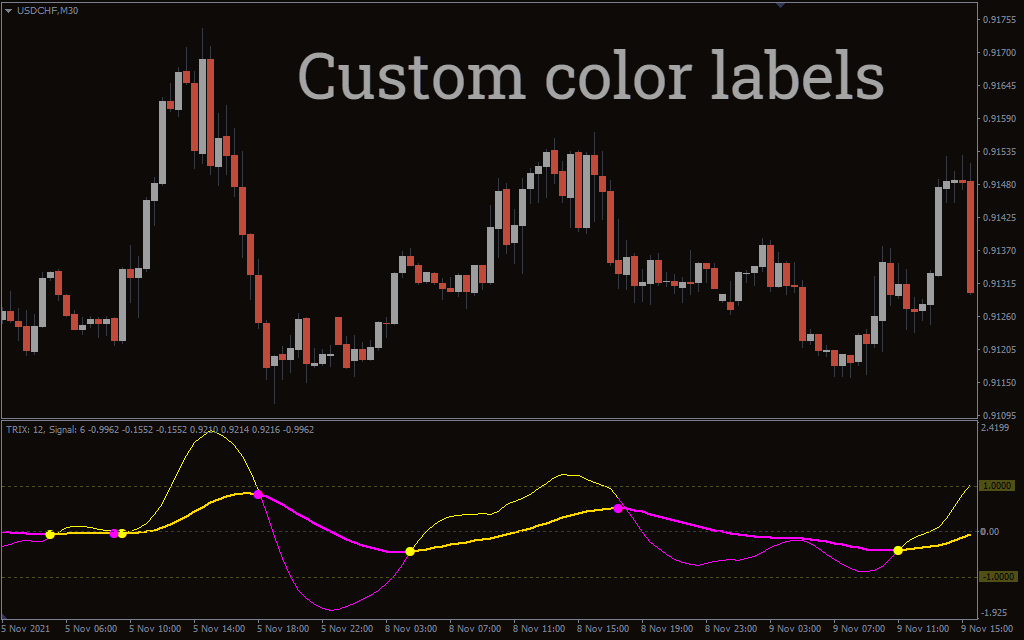
The “Trix” indicator provides trade signals in the form of green and red dots. When the fast line crosses the slow MA upwards, a buy signal is formed (green point). A sell signal is displayed as a red dot. At these moments, the fast line crosses the slow MA downwards.
In the example above, the “Trix” indicator signals the formation of a buying momentum. The support level acts as an additional signal.
The combined use of the two indicators provides a potential opportunity to open a buy trade. It is safer to place the stop loss behind the support level to prevent accidental price movements that might close the trade.
The combination of the resistance level and the “Trix” indicator, as in the example of buying, in this case, gives a quite reliable signal to sell.
In this situation, the stop loss should be placed behind the resistance level to prevent unexpected price movements and position closing.