
Triangle pattern indicator
Forex BUY and SELL signals from the best Triangle pattern indicator for MT4. Find the trend continuation with the triangle pattern.
Description
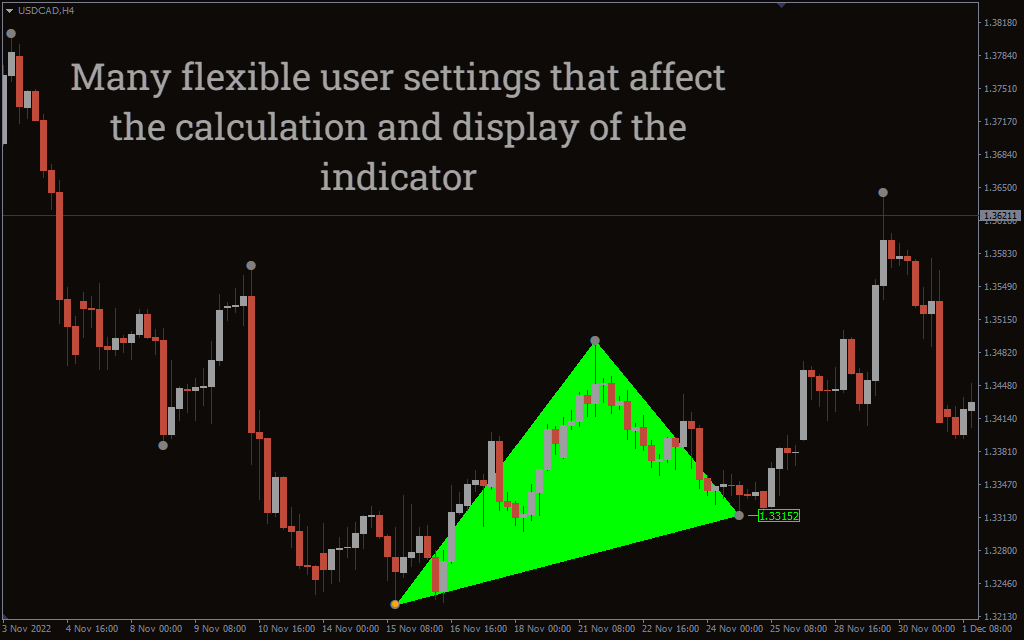
The Triangle pattern indicator is an MT4 indicator that plots the chart’s pattern. The triangle is one of the most popular chart patterns and suggests trend continuation. The indicator draws triangles on the chart by connecting the upper and lower trendlines. The upper trendline connects the highs, while the lower trendline connects the lows. The indicator plots all three types of triangles; ascending, descending, and symmetrical. Traders need to know about these types before taking positions with the indicator. Traders should apply the indicator on longer timeframes to locate the triangles.
This indicator is complemented by other pattern-based tools on our website like the ZP Three Drives Patterns Indicator and the Harmonic Pattern Indicator. Traders also benefit enormously from using these indicators to find more sophisticated price structures in their data.
Triangle pattern indicator for MT4 BUY/SELL signals
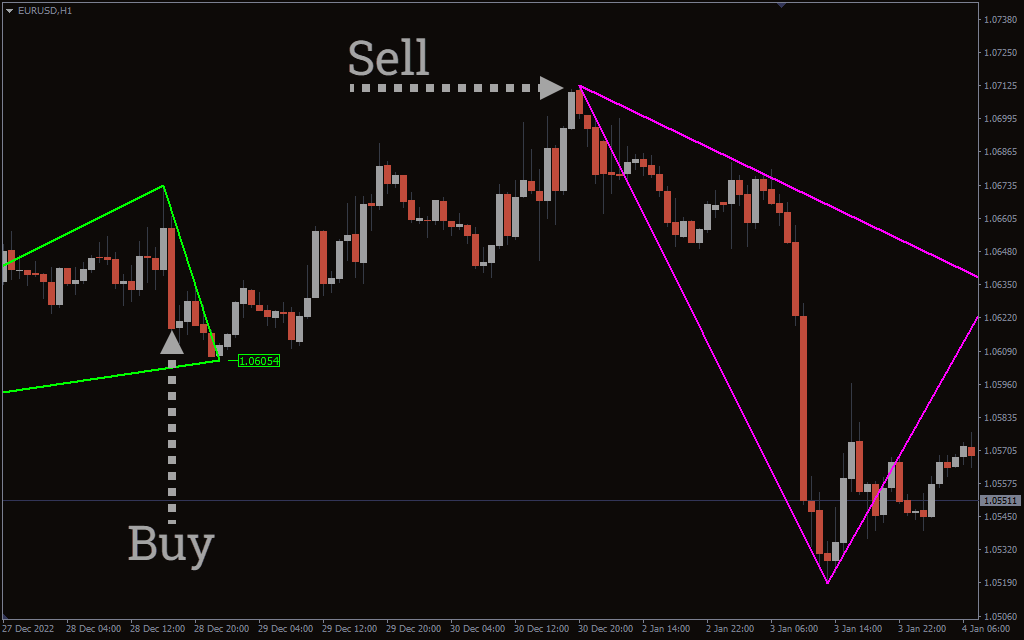
The above EUR/USD H1 chart shows the Triangle pattern indicator BUY and SELL signals. To enter the trades, traders need to look for triangles. Whenever the indicator plots triangles, it suggests a trend continuation. For example, on the chart above, we have uptrend and downtrend continuation after the appearance of the triangles. The indicator works best on its own, but traders can apply Moving Averages or MACD for further signal confirmation.
In real trading situations, I’ve learned, waiting for a visible breakout and a strong candle close outside the triangle greatly increases accuracy. I do not enter right away but rather let the price validate direction with momentum, especially during high-liquidity sessions.
A second useful insight is that symmetrical triangles may take more patience to break, while ascending triangles and descending triangles break in a more directional fashion so can be a little easier for beginners trading.
Pros and Cons of the
 Pros
Pros
- Provides a clear indication of classic triangle continuation patterns with little manual drawing
- Works well on higher timeframes with fewer false breakouts.
- Helps traders keep track by keeping them in accordance with the dominant trend.
- Easy to get started with and easy to interpret.
 Cons
Cons
- Less effective in ranging or choppy market conditions.
- False breakouts can occur on lower timeframes.
- Best results will only come after confirmation by volume or momentum indicators.
Conclusion
The Triangle pattern indicator draws triangles on the chart. These patterns act as a continuation pattern, and traders can take positions accordingly. You can download the indicator for free on our website.
If you are still being challenged about triangle breakouts being a good fit for your trading personality, our article Day Trading vs Swing Trading will tell you what timeframes and strategies fit best with your style, which is great.
Frequently Asked Questions (FAQ)
 Which timeframe is best for trading triangle patterns?
Longer timeframes like H1, H4, and Daily usually produce more reliable signals.
 Does the Triangle pattern indicator repaint?
No, it recognizes triangles using confirmed price data.
 Should I trade breakouts or wait for retests?
Unlike traditional volume bars, this indicator filters and smooths the volume data to give a clearer trend of buy vs. sell pressure.
 Can this indicator be used appropriately by beginners?
Waiting for breakout confirmation or retests usually leads to better quality trades.
 Can this indicator be combined with other tools?