
Tick Volume Indicator
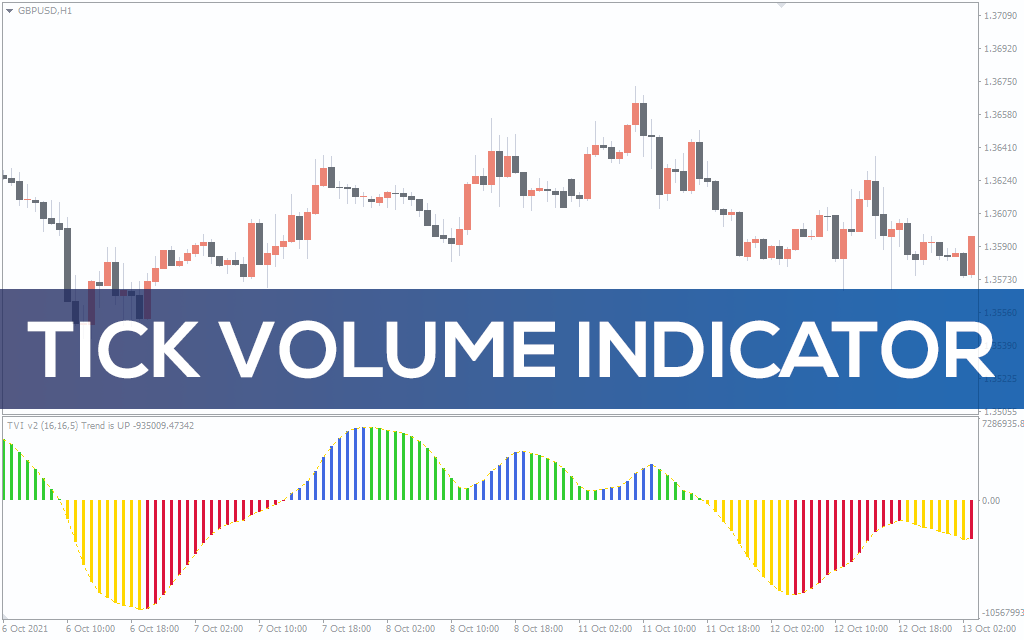
The tick volume indicator displays the number when the volume is up and down of any currency pair.
Description
Using Tick Volume Indicator
The tick volume indicator is an MT4 indicator that highlights displaying the volume of a currency pair.
It forms several bars on the chart, creating a wave-like structure. The bars come in various colors. When there is little or no volume, the indicator draws red and golden color bars. On the other hand, the indicator illustrates blue and green colors when there is a significant volume.
As a trader, the indicator comes in handy when deciding whether to jump in or wait for the volume to occur. As we know, volume is one of the most important factors in determining the pair’s strength, so by applying the tick volume indicator, you can determine overall entry points.
The indicator alerts you when the volume changes from low to high, signaling that you can go long or short.
How to trade the tick volume indicator?
As already mentioned, volume determines the strength of a currency pair. Therefore, tick volume is beneficial because it presents you with a clear idea of where the pair is heading.
Generally, when the volume is high, the pair tend to present more trading opportunities. So, by applying the tick volume indicator, you can find out if there is a major volume.
The indicator forms a wave-like structure. The high waves on the upside tell us there is a high uptrend volume, and we should take long positions.
On the flip side, the indicator shows waves on the downside, signaling that we should go short.
Let’s find out the buy and sell strategy for the indicator:
Buy strategy
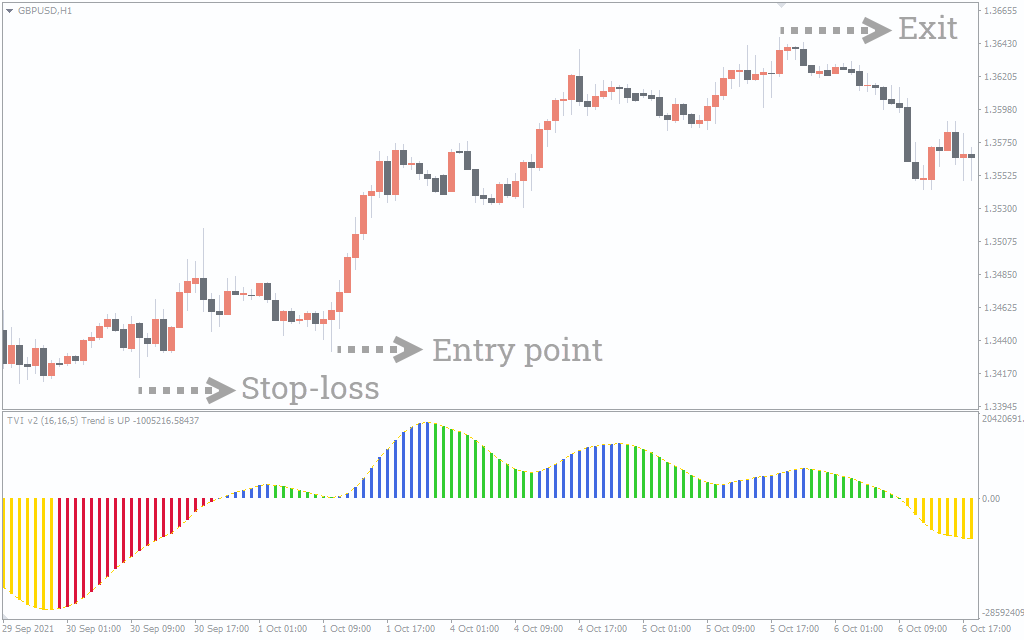
- Tick volume should show green and blue waves.
- Wait for the volume to rise along with the price action.
- Enter the trade after the tick volume shows two or three upside bars.
- Place a stop-loss near the low of a buying point.
- Leave the trade when the volume decreases.
Sell strategy
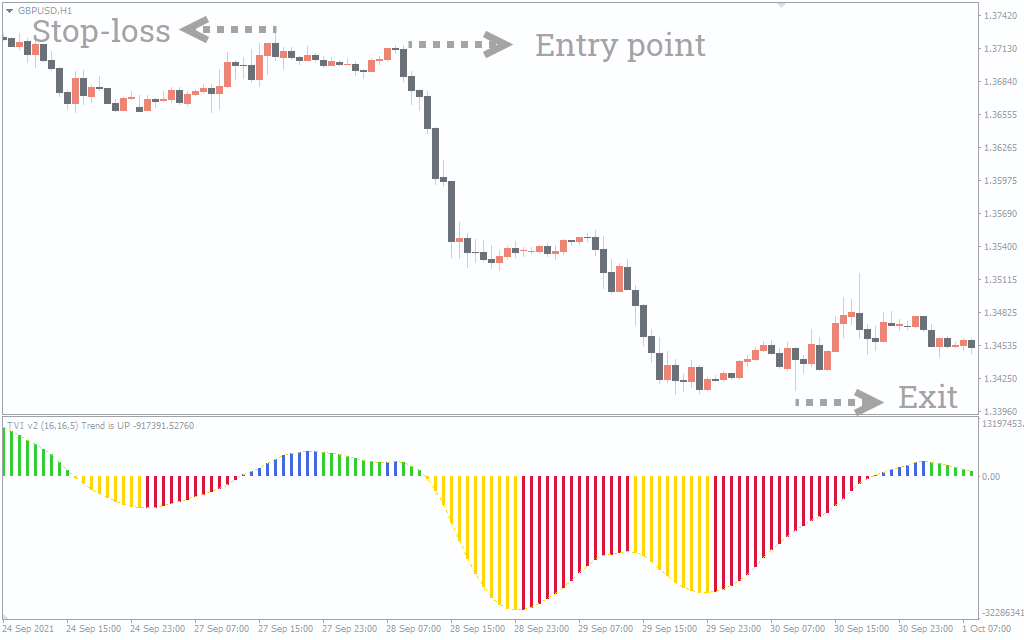
- Tick volume should show red and golden waves.
- Wait for the volume to dip along with the price action.
- Enter the trade after the tick volume shows two or three downside bars.
- Place a stop-loss near the high of a selling point.
- Leave the trade when the volume increases.
Conclusion
There isn’t a specific timeframe for the tick volume indicator, but you should apply it on charts above 30 minutes. However, the indicator does give you an idea of when to enter the trade and when to refrain from it.
For more accurate trading signals, you can combine the indicator with others like the RSI or MACD.