

TDI RT Alerts Divergence Indicator
Determine the current strength of a trend, and measure volatility with the help of TDI RT Alerts Divergence indicator.
Description
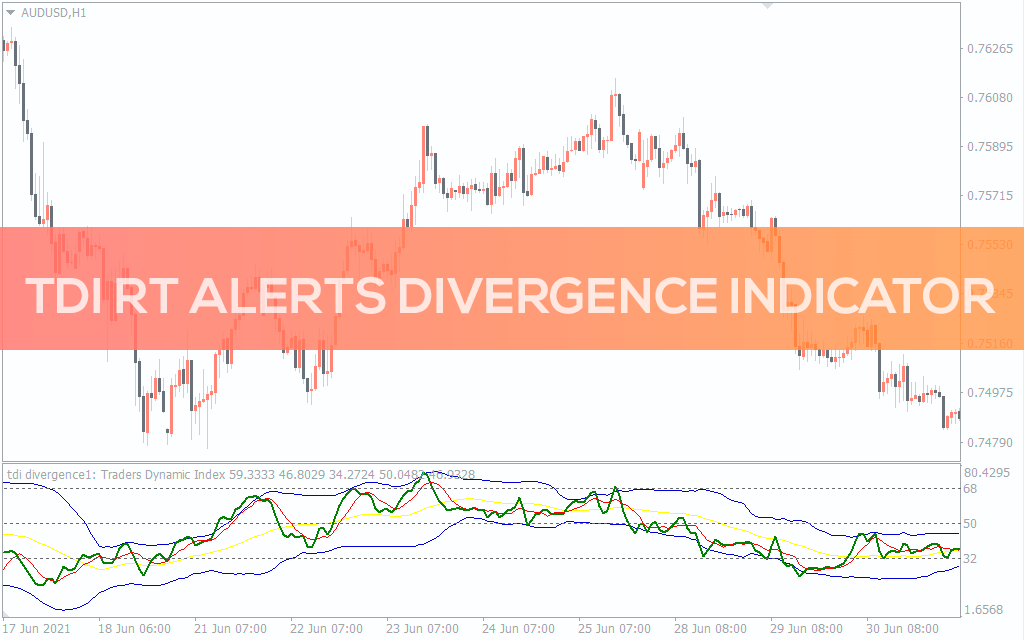
The Traders Dynamic Index indicator is a fusion of indicators. A trader can monitor the market situation from several perspectives using the TDI RT Alerts Divergence. It assists in determining the direction and strength of a trend, as well as market volatility.
In this guide, we will dig deeper into what the TDI RT Alerts Divergence indicator is and how you can use it in your trading strategy.
What is a TDI indicator?
When it first arrived in 2005, the TDI was a pioneer indication. Dean Malone developed the Traders Dynamic Index to monitor market conditions and detect trade signals.
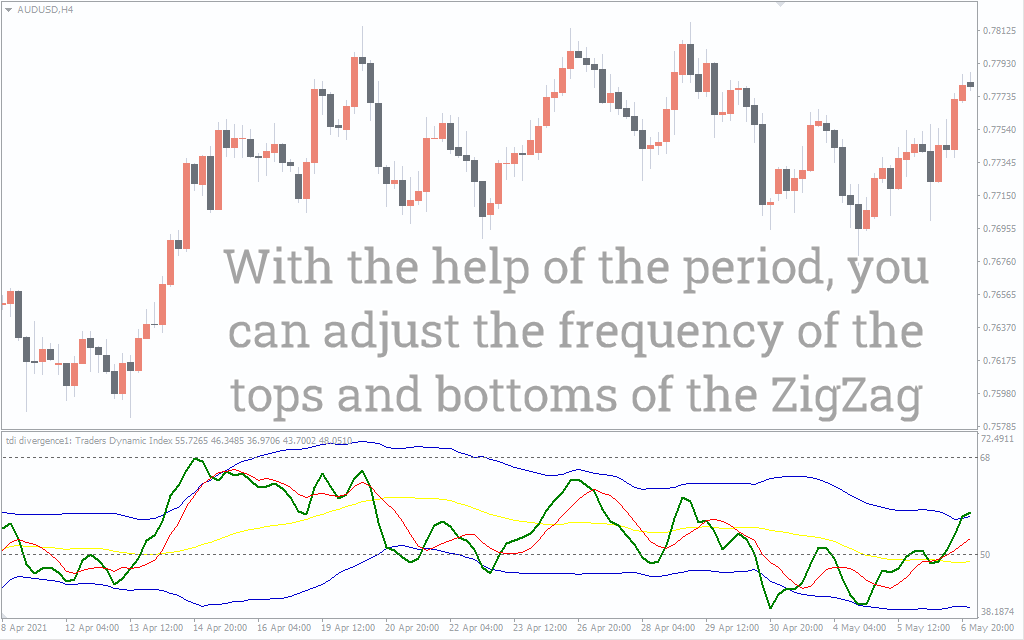
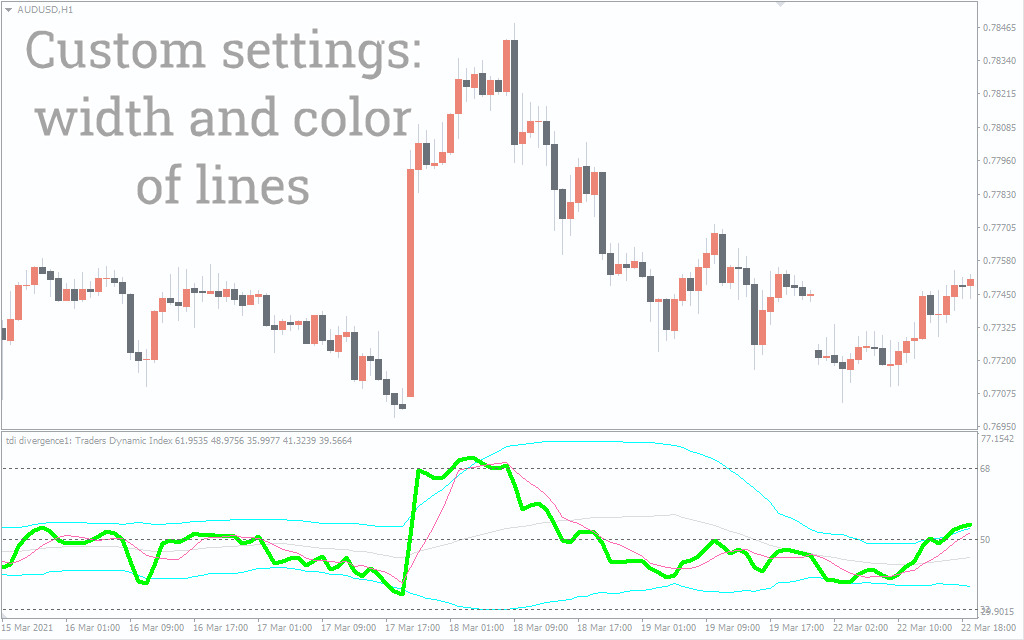
The TDI is based on the basic RSI indicator, which defines the strength of the current trend or the amount of price change. To smooth the lines, the moving average method is utilized, and Bollinger bands are used to measure the strength of the fluctuations. Because of an integrated approach, the TDI RT Alerts Divergence indicator can be used as a comprehensive trading system on its own.
This trading instrument displays the current trend’s direction and speed at the same time, allowing a trader to pick the best period to enter a trade. Despite its complexity, the indicator’s operation is simple to grasp.
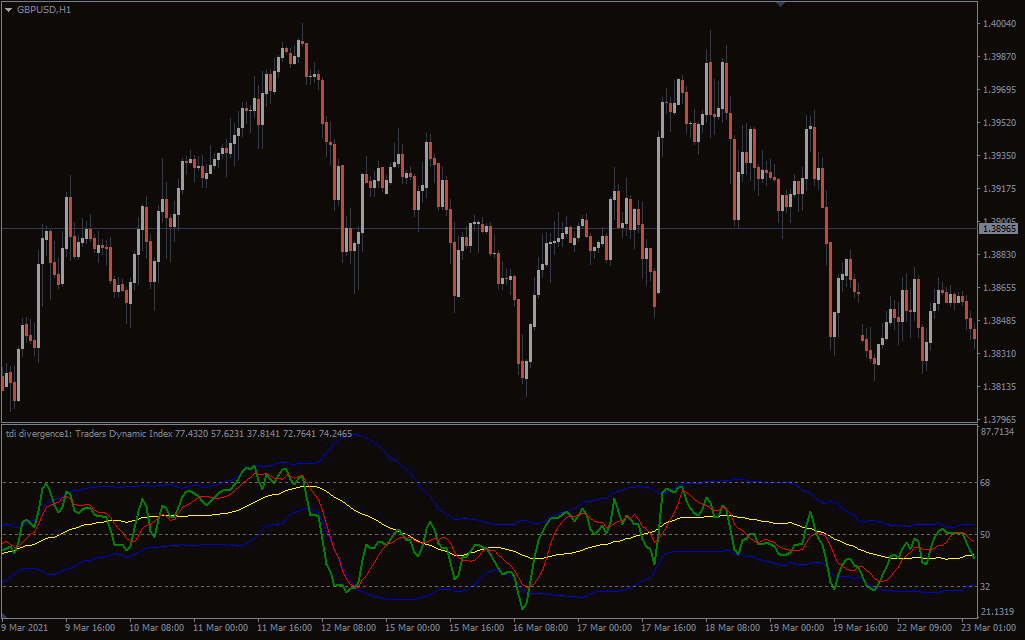
The green line shows market sentiment and is comparable to the RSI. It demonstrates how the market is reacting to positive and negative expectations.
The red line is a crossover of the green line and can be utilized for market entry and exit.
The yellow line represents the overall market mood. It depicts the market’s general trend.
Finally, we have two blue lines, one above and one below—these blue lines, like the Bollinger Bands, show market volatility.
How to use the TDI indicator?
The indicator can be used to figure out the current trend. The presence of a green line above a red line indicates a shift in the short-term trend from downward to upward. When green falls below red, the short-term trend shifts to the downside.
The TDI indicator’s most significant line is the yellow line. The line connects all of the other components and makes the indicator tradable. Long-term trends can be determined using the yellow line. When the line repels from these bounds, it indicates the possibility of a trend change.
In addition, the indicator indicates current market strength.
Typically, the greater the slope of the green line, the more powerful the market participants. Conversely, if the line goes horizontally rather than vertically, we have an excessively inactive market.
The widening of the Bollinger Bands indicates an increase in volatility. On the contrary, a narrowing of the lines suggests a decrease in volatility. With a significant narrowing of the lines, one should expect the release of any big reports or other news that can significantly affect the market. In such instances, it is preferable to stay from trading for the time being.
TDI indicator trading strategy
The indicator can be used for short-term and medium-term trading. You should use an H-1 or higher timeframes when looking for signals with a TDI indicator.
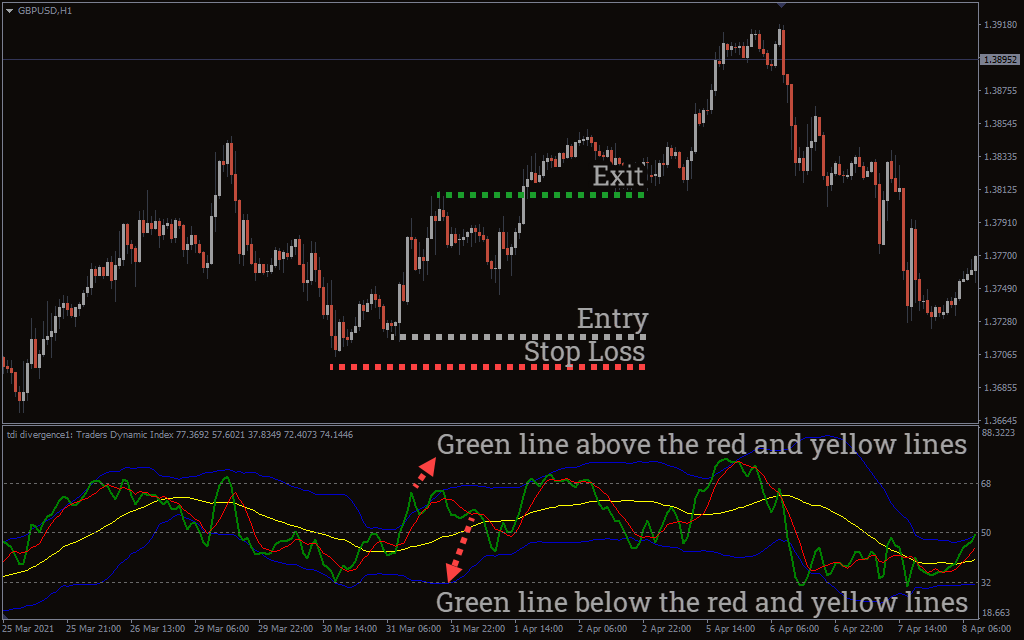
TDI buy setup
- The green line should be above the yellow and red lines
- Wait for the bullish candlestick to appear
- Place a stop-loss near the recent low
- Exit when the green line dips below the red line
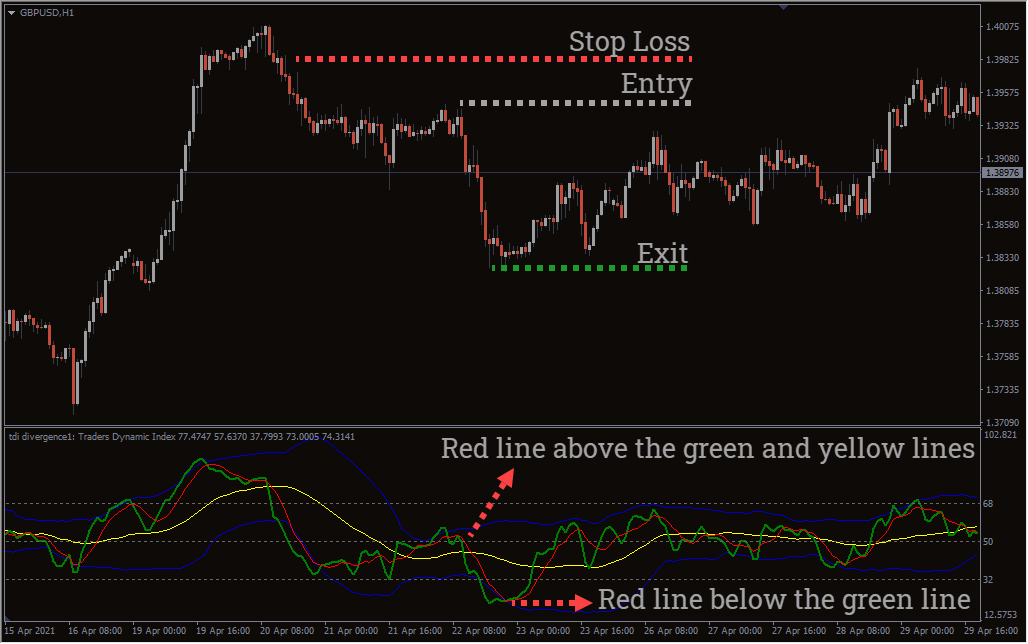
TDI sell setup
- The red line should be above the yellow, and the green lines
- Wait for the bearish candlestick to appear
- Place a stop-loss near the recent high
- Exit when the red line dips below the green line
Conclusion
The TDI RT Alerts Divergence indicator is a great tool for determining market trends and volatility. It is recommended to use on assets with stable volatility like the major forex pairs.