
TDI Indicator
Ideal indicator for sell and buy signals. Free download. A perfect tool for identifying suitable trade entry and exit points.
Description
The Traders’ Dynamic Indicator (TDI) was designed by Dean Malone. It is based on the Relative strengths index (RSI), Moving Averages, and Bollinger band. The integrated indicators great provide trades signals and a clear picture of the market movement.
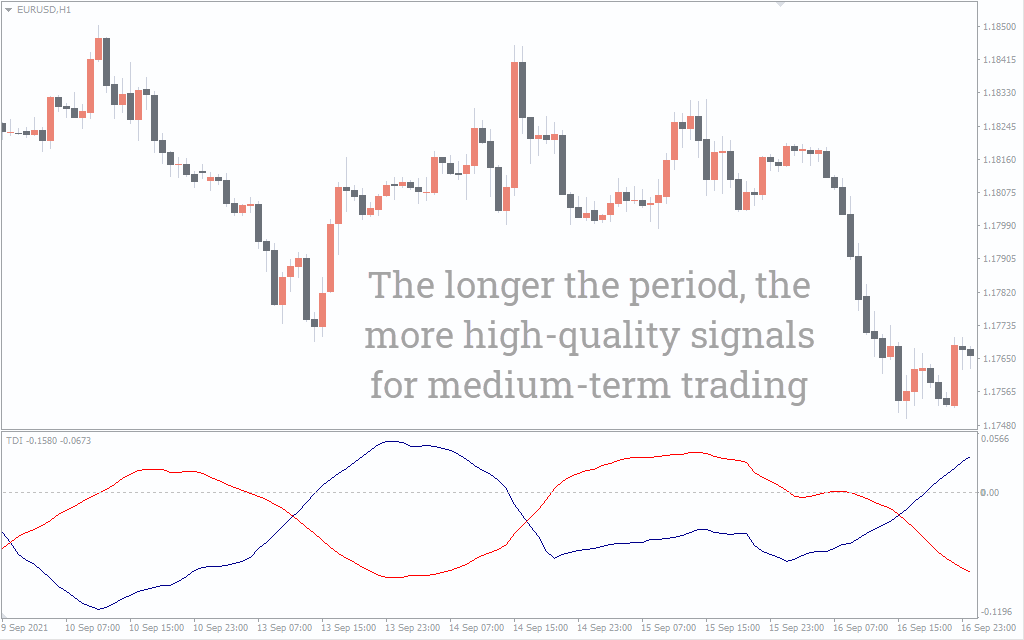
The TDI indicator for MT4 – free download appears on a separate window below the price chart and comprises blue and red lines. The blue line is known as the fast, while the red line is the signal and is calculated using a longer period. Essentially, the two lines depict the market strength and volatility. Investors get trading signals when the two lines cross.
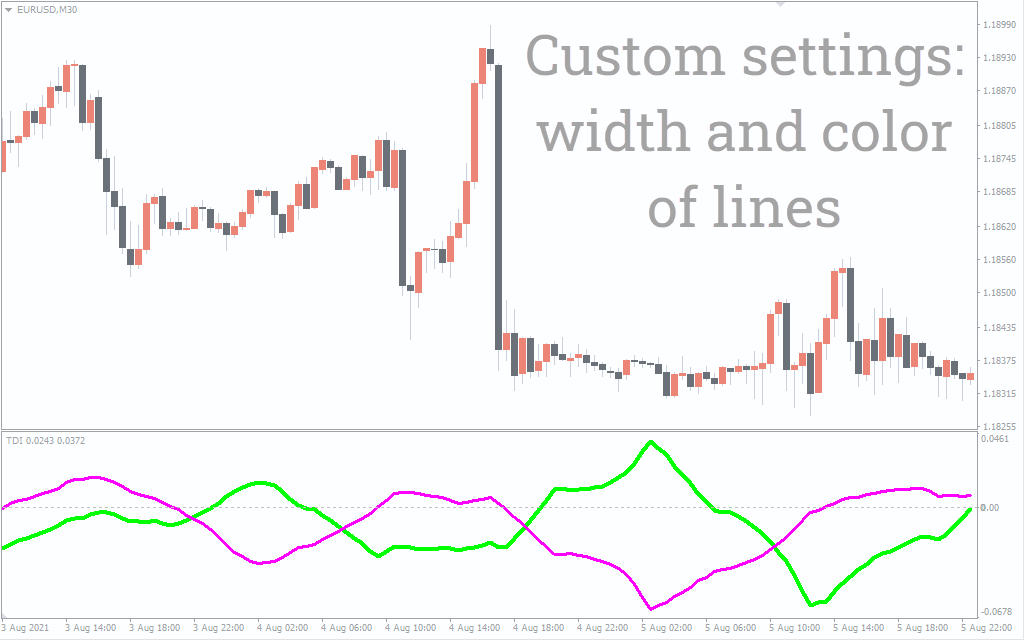
Besides the two RSI lines, the TDI indicator also comes with three bollinger bands. Two lines are blue and mark the area between 68 and 32. The central axis or middle line is yellow. The area above the 68 level is overbought, while the oversold is the region below 32.
TDI Trading Signals
Now, here is the big question; how do you get trading signals using the TDI indicator? Essentially, you should wait for the red and the blue line intersect. The buy signal occurs when the blue line crosses the red line from below. Conversely, if it crosses the red line from above, that is a telltale sign of the sell signal.
It is prudent to make use of the yellow line to get a stronger signal. For example, when the red line crosses the yellow line from below, it signals that the bulls are stronger. Therefore the investors should buy. Similarly, when the red line crosses the yellow line from the top, it is a bearish signal you should be ready to open short positions.
The indicator also provides another signal when the yellow line crosses the 50, 32, and 68 levels. The overbought areas signal an impending market reversal.
Exit Strategy
For buy positions, take profit at the next resistance level or when the blue line crosses the red line from above.
For sell positions, take profits from the next support level or when the blue line crosses the red line from below.
Chart Example
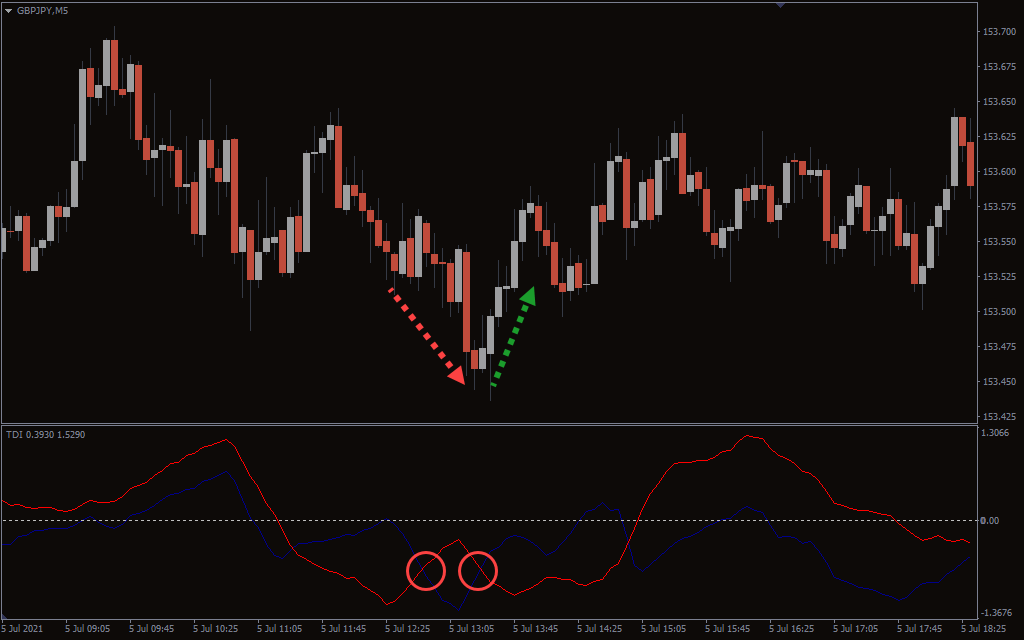
The chart above shows price movement for the GBP/JPY on a five-minute time frame. The green line intersects red line from the top ((shown by the red arrow). Similarly, the price rises when the blue line crosses the red line from below.
Conclusion
The traders’ dynamic indicator is a great tool for identifying sell and buy signals. Essentially, you only have to wait for the line to cross and enter your positions. Remember the indicator comingles RSI, Moving averages, and Bollinger bands indicators. This means you can use the indicator as a stand-alone strategy. However, it is prudent to combine with other strategies to get more perfect trade entries.