

TD Sequential Indicator
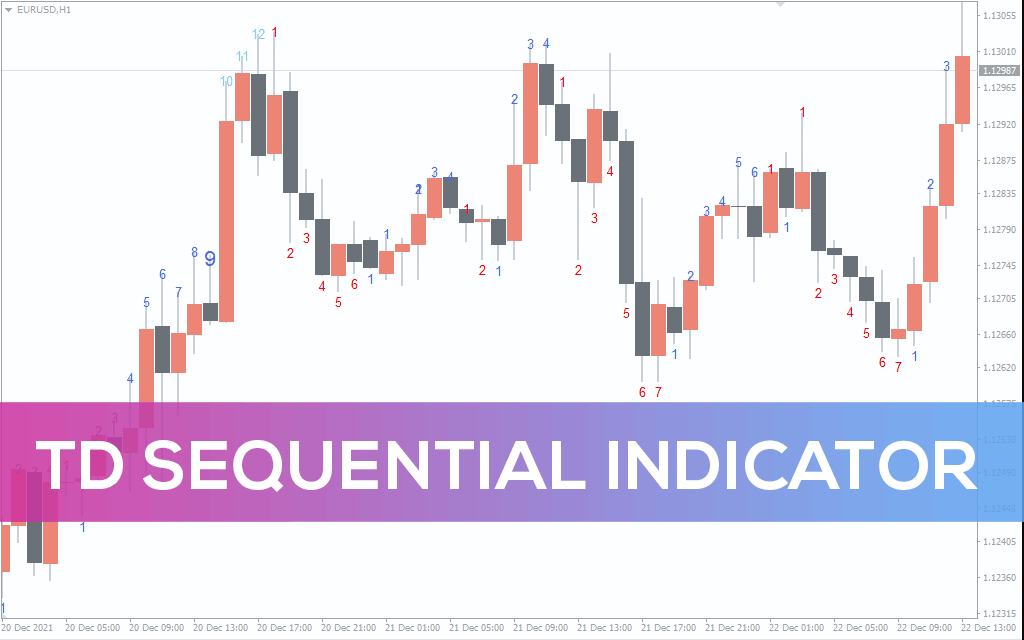
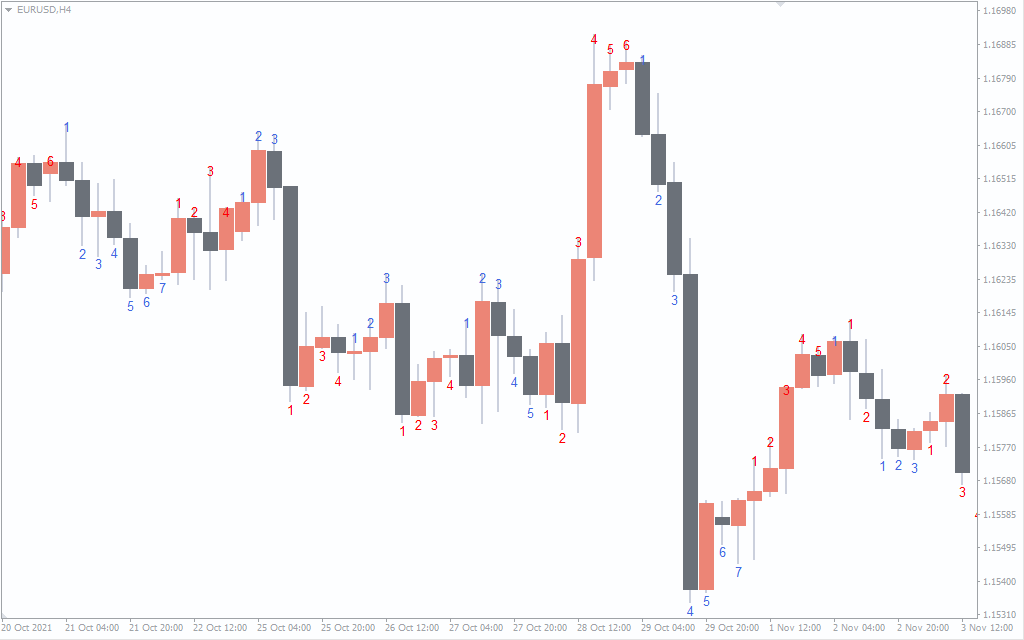
TD Sequential is an advanced technical method of reading price charts. Best intraday buy-sell indicator for MT4. Identifies potential forex & stocks trend signals
Description
TD Sequential covers all the components of Tom DeMark’s famous technical analysis method of anticipating trend reversal conditions.
This indicator works as a universal key for revealing the changes in price momentums. It applies a theory of counting the bars based on their highs and lows for analyzing market biases.
In the past, traders used to apply DeMark’s method by marking the candles manually, which was a bit challenging and complex, especially for beginners. Thankfully, TD Sequential indicator for MT4 makes it more convenient to benefit from this excellent price-action trading method.
According to our research, TD Sequential applies to all types of asset classes listed within MetaTrader 4 platforms. Moreover, it suits all timeframes allowing you to conduct MTF chart analysis.
This guide explains how to apply TD Sequential to anticipate highly probable buy-sell signals based on solid trend reversal conditions of the market.
How to trade forex and stocks by using the TD Sequential indicator for MT4
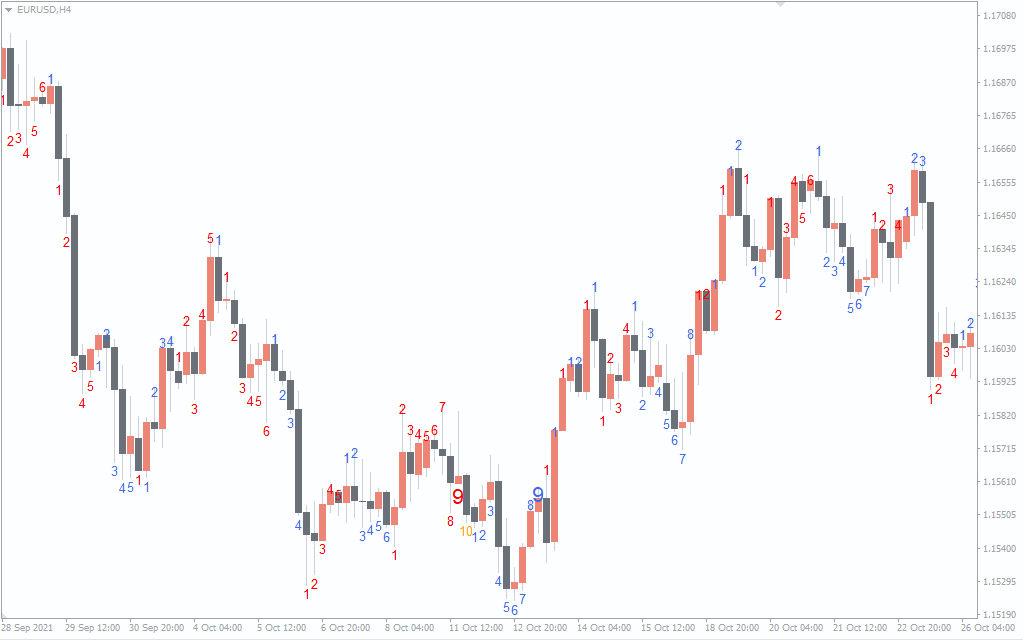
After you install TD Sequential in your MT4 platform, the indicator begins its automatic process of marking the candles in numeric order. Candle 1 is the beginning of a newly formed trend, and candles 9 to 12 are considered the possible ending point of the current market trend.
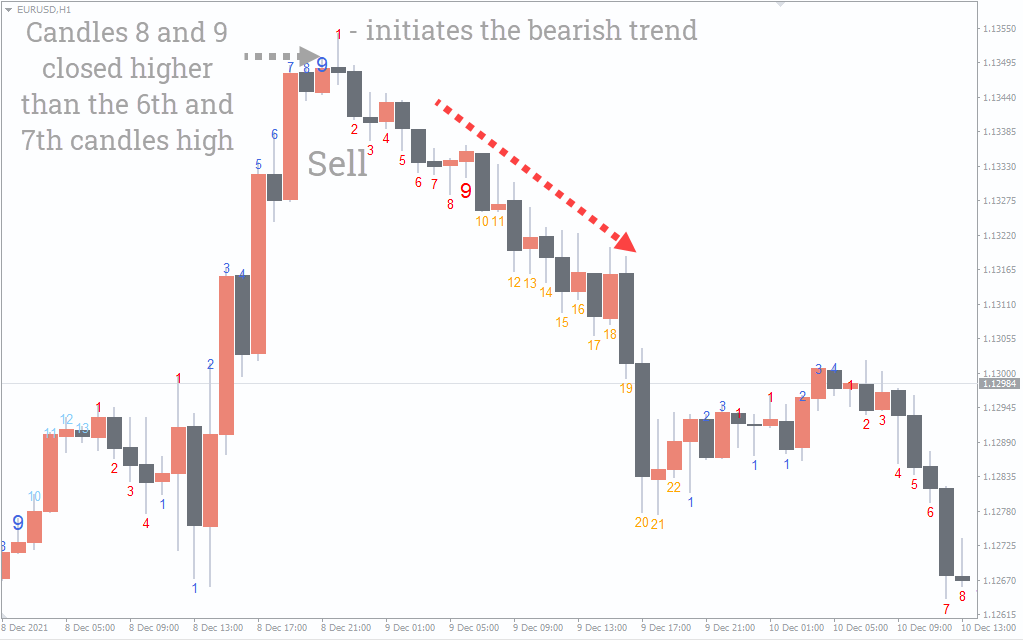
While determining trend reversal signals, you’ll need to compare the highs and lows of the price bar in sequential order. For instance, candles 8 and 9 surpass the high of candles 6 and 7 to signal a bearish trend reversal. On the other hand, during downtrends, candles 8 and 9 breaking the low of candles 6 and 7 indicates a bullish trend reversal.
Once the 8th and 9th candles signal a reverse of the price trend, wait for candle 1 to be formed for triggering a buy or sell order within the trend direction. For instance, in the above chart, the EURUSD price was trending up until candles 8 and 9 closed higher than the 6th and 7th candles high. Therefore, it is a bearish trend reversal signal. Next, the indicator spots candle 1, a large bearish price bar signaling the beginning of a downtrend market. In such a condition, we may place a sell order right after the close of candle 1.
Here is the summary of TD Sequential buy-sell rules:
Buy Conditions:
- Candles 8 and 9 exceed the low of candles 6 and 7 during a downtrend market
- Candle 1 appears as a bearish price candle
Sell Conditions:
- Candles 8 and 9 close above the high of candles 6 and 7 during an uptrend market
- Candle 1 appears as a bullish price candle
Conclusion
Determining a fresh market trend from its very beginning is crucial for both trend-following and swing traders. If you’re late in identifying a new price trend, it means either you’re making a late entry or missing out on the entire price movement. The TD Sequential indicator maps the price chart showing you exactly where to look for the trend reversals so that you can make the most of solid market momentums. Moreover, it is easy to use, comprises simple trading rules, and suits beginners in forex and stock markets.