

Standard Deviation Indicator
The Standard Deviation indicator is a technical indicator that measures market activity based on volatility. You can use the indicator to build your trading system.
Description
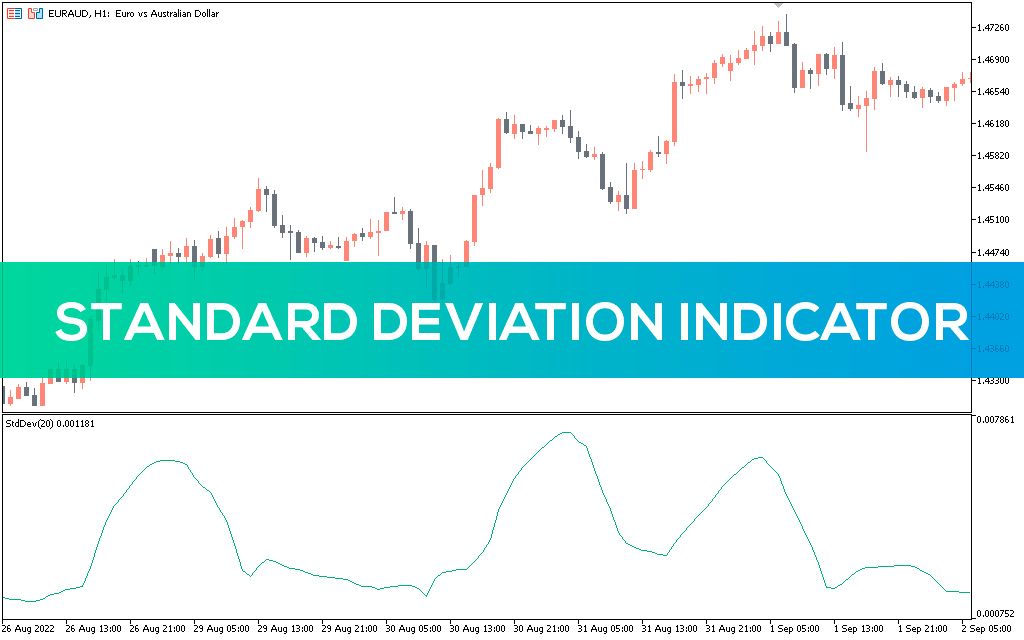
The standard deviation indicator measures market activity based on current volatility. It shows when an asset enters or exits an inactive state. The estimate is based on the deviation of the price from the selected moving average.
The idea is that the financial market has periods of rest and periods of activity. So it is desirable to always see points and zones of price equilibrium. According to statistics, such a line is a linear regression. The concept of a standard deviation shows the difference from its value:
- Upward deviation – the predominance of selling
- Downward deviation – the predominance of buying
Prices between the lower and upper limits of the Standard Deviation indicator are considered the equilibrium zone.
Calculation of the standard deviation indicator
The calculation of values is taken from classical statistics and applied to current prices:

Where:
StdDev (i) – standard deviation from the current candle;
n – smoothing period;
AppPRICE (in) – price applied to the bar with the corresponding number;
AppPRICE (i) – price used for the current candle bar;
SMA (apPRICE(i), n, i) – any moving average of the current bar for n periods.
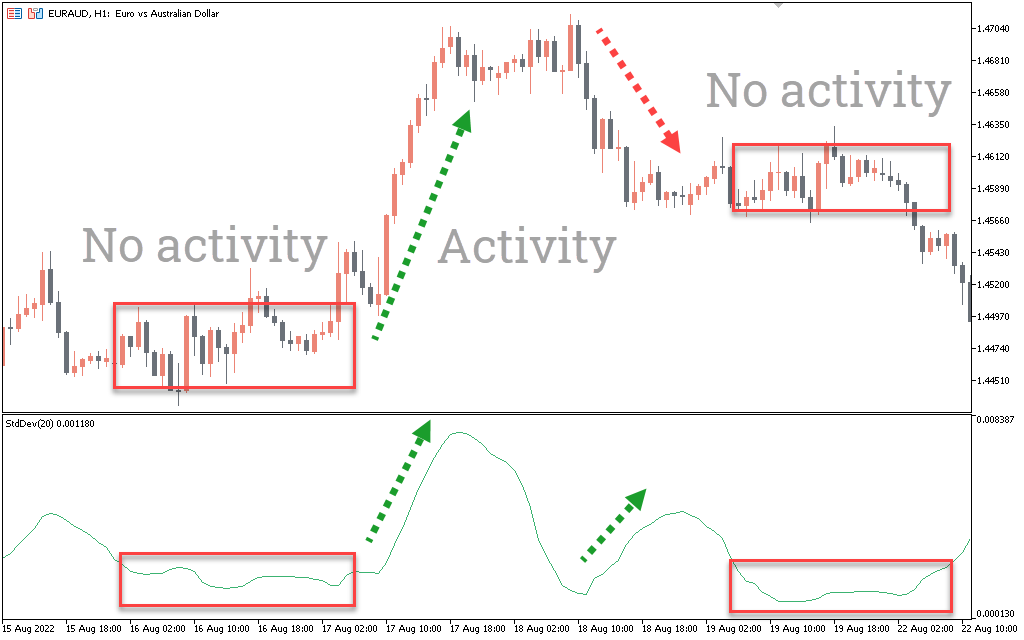
The absolute value of the indicator is usually not used for analysis. No clear trend direction is shown. Only the general dynamics of the line is important – active or “sleeping”.
How to use the standard deviation indicator in trading?
Ease of use compensates for complex calculation:
- Small values of the SD indicator characterize the market as passive (flat), that is, you need to wait for a breakdown in any direction.
- A rising line means an increase in activity (i.e., the deviation from the mean increases), and the faster it rises, the stronger the subsequent price movement.
- The line pullback from the high means a decrease in volatility (decrease in market activity).
Standard Deviation Indicator Trading Strategy
Besides, a trading strategy based on standard deviation is discussed below:
[scname=”ads in article”]
Buy strategy
- Look for the SD indicator when the phase is stable.
- Wait for the SD indicator to increase and move out of the flat zone.
- Wait for a bullish candle to appear.
- Enter the market with a stop loss below the local low and take profit near the next horizontal level up.
Sales strategy
- Look for the SD indicator when the phase is stable.
- Wait for the SD indicator to increase and move out of the flat zone.
- Wait for the bearish candle to appear.
- Enter the market with a stop loss above the local high and take profits near the next horizontal level on the lower side.
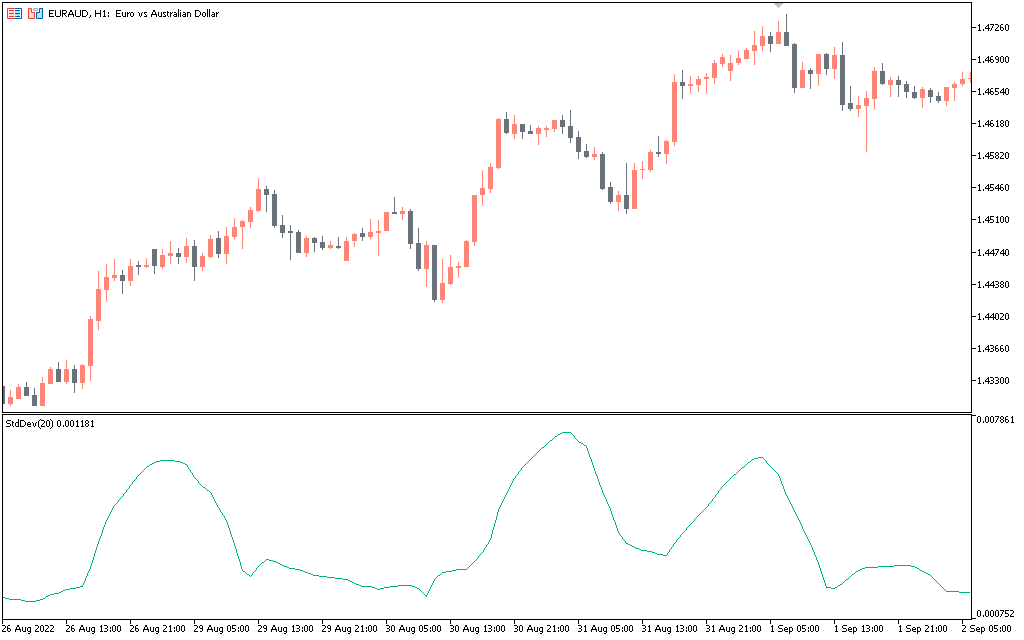
Displaying the standard deviation indicator
Standard deviation is a technical trend indicator. It can be used to find active and inactive market states. Moreover you can use an indicator to enter trades, but it is wise to use a confirmation tool to increase the chance of success.