

SR Indicator
Identify accurate support/resistance levels & precise Buy-Sell entry positions. Best technical indicator for forex/stock price action trading. Suits MTF charts.
Description
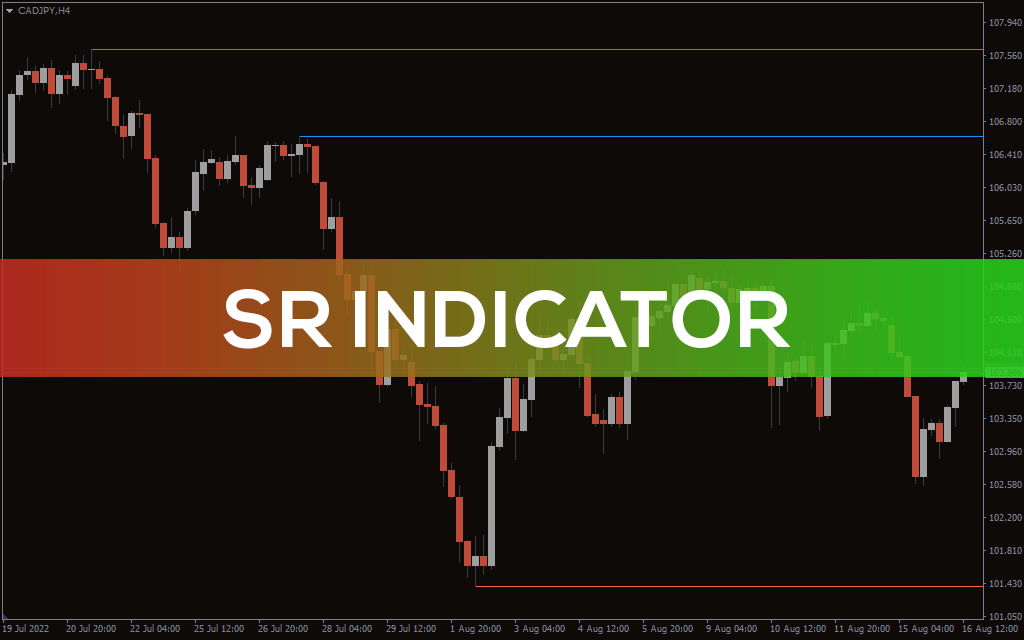
The SR Indicator highlights potential market highs and lows, which work as strong support/resistance levels. This indicator works best for technical traders in forex and stocks, considering key price swing positions for placing buy-sell orders. It helps you determine possible pullback and breakout levels of the price.
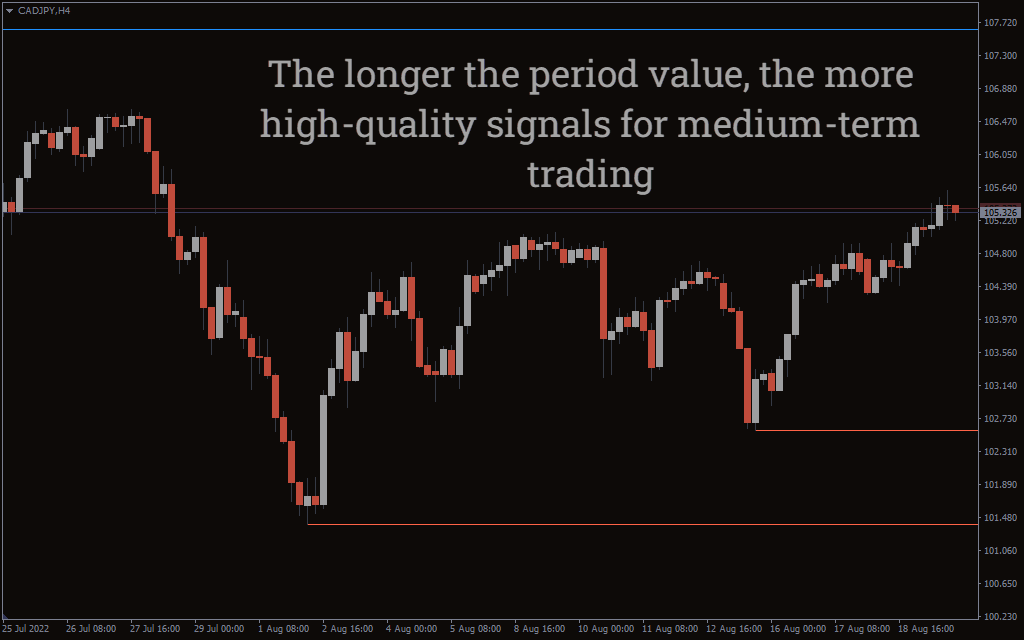
The SR Indicator works on MTF charts and shows highly probable event areas in all market conditions. It weighs more on recent price action changes, helping scalpers and intraday traders assess key trading levels.
Technically, this indicator works as a price charting tool that doesn’t deliver a direct trading signal. It weighs more on recent price action and determines the nearest support and resistance to the current price levels. Identifying solid price reversal patterns near the SR levels will enable you to assess potential trading opportunities.
This interactive guide will teach you how to trade forex and stocks using the SR Indicator in MT4. Also, we’ve included chart examples and the MetaTrader settings of the indicator for your better understanding.
How to determine Buy-Sell signals using the SR Indicator in MT4
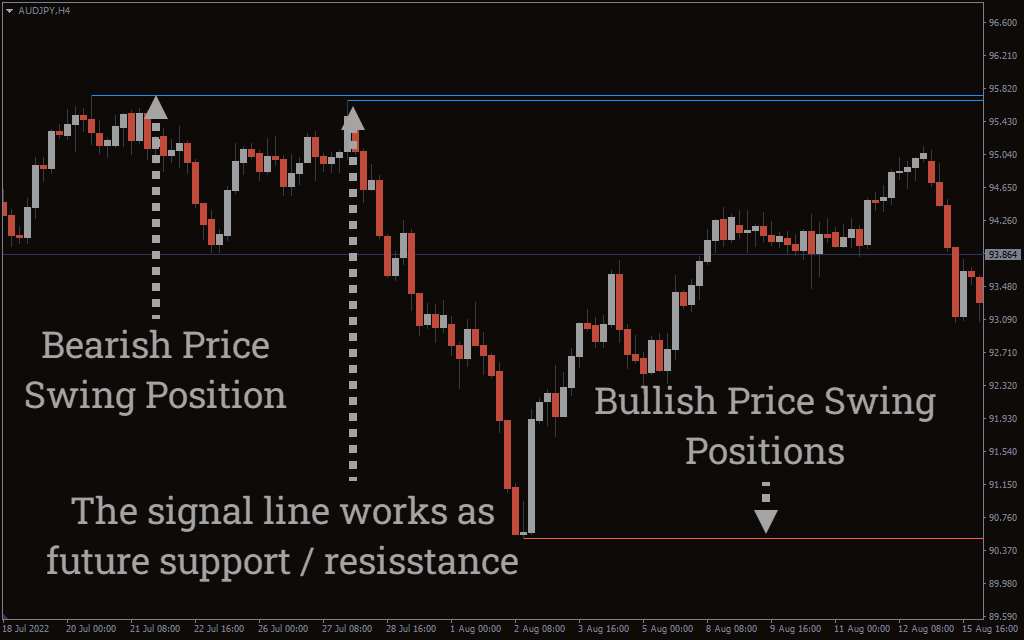
The SR Indicator works as an automatic support/resistance detector. Once you install it to your MT4 platform, it automatically starts examining the recent price actions.
The indicator assesses the maximum price correction or retracement levels in on-trend and ranging markets. For this reason, you’ll find it not highlighting every price swing position the chart prints. Instead, it filters several market areas and picks the most potential one to trade. Its main goal is to determine valid market highs and lows. Such price levels assist you in discovering key trade entry positions and possible buy-sell signals.
The red horizontal line at the bottom shows the support level. This level represents the potential zone for going long. We’ll consider a buy order when the price fails to break the SR indicator support and rebounds from the respective level.
Oppositely, look to go short once the price rejects the SR indicator resistance. A false break or bearish price reversal pattern below the blue line is ideal for activating sell orders. Apart from reversal patterns, the SR indicator also helps you anticipate strong price breakout levels. Consider going long/short depending on the price break direction at the appropriate SR zones.
Conclusion
The SR indicator is a super technical companion for price level analysis in MT4. It works on MTF charts and supports different asset classes, including forex, stocks, cryptocurrencies, etc. Also, it helps you ignore invalid pivot or support-resistance levels and avoid weak trading signals. Using this indicator will enable you to pick the right price level for entering buy-sell orders. Besides professional traders, beginners may also find the SR indicator extremely useful in identifying best possible trading zones in live markets.