

Squeeze Break Indicator
A super tool for tracking trends in Forex and other markets. Compatible with all timeframes. This Squeeze Break indicator supports alerts so you won’t miss a single signal.
Description
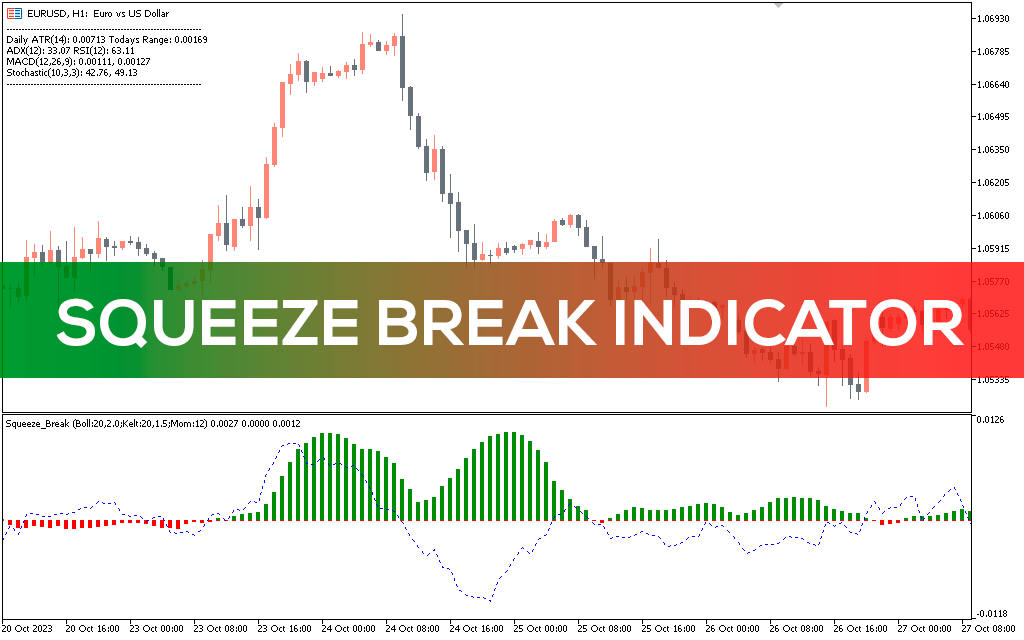
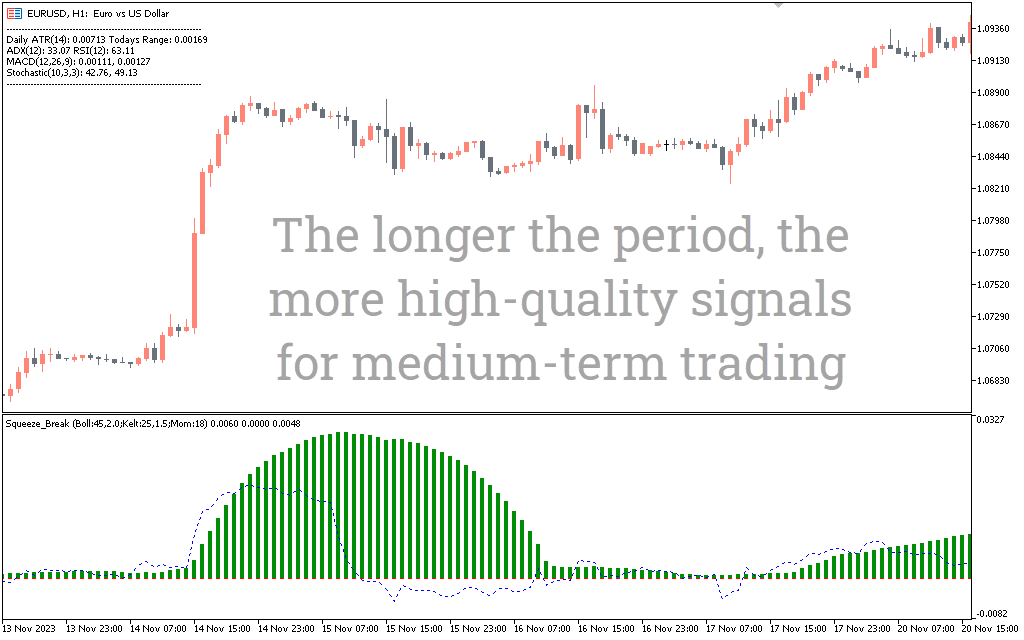
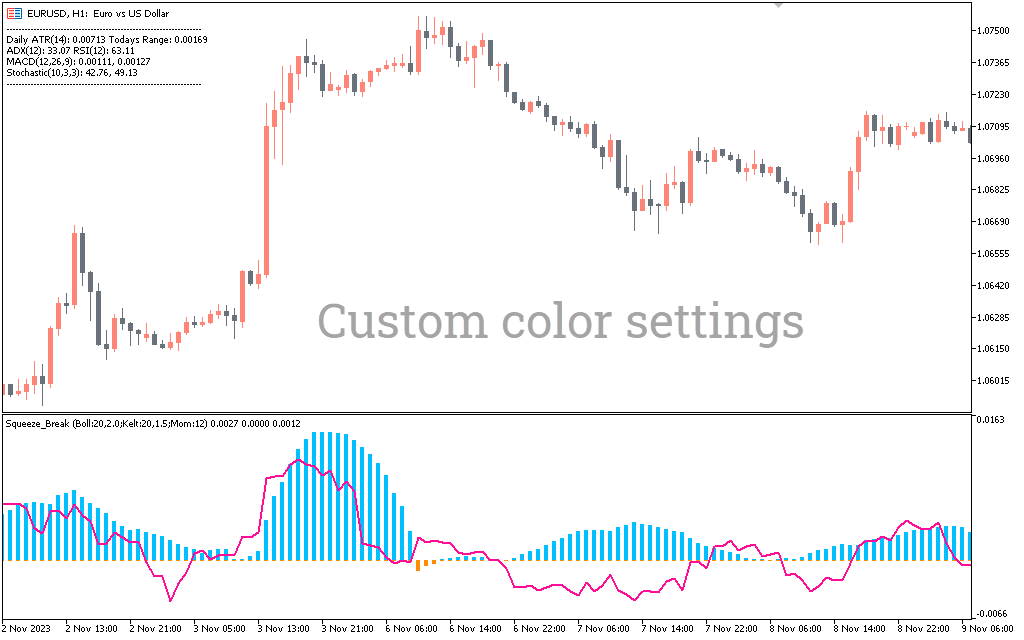
This Squeeze Break Indicator is designed for trading a strategy first mentioned in the book Mastering Trading, written by John Carter. The strategy is based on the changing volatility of any market. Both in the Forex market and in the stock market, the stages of trend alternate with stages of stabilization. And to make money, you need to buy at the beginning of a bullish trend, sell at the beginning of a bearish trend, and hold the position until the trend continues. The Squeeze Break indicator for Metatrader 5 will help you with this. It is displayed in the window below the price chart and consists of a red-green histogram and a blue oscillator line.
The histogram shows the presence of a trend. If there is a trend in the market, the histogram is green; if there is no trend, the histogram is red. The more bars in the histogram, the stronger the trend.
The blue line shows the direction of the trend. If the blue line is below zero, the trend is bearish. If the blue line is above zero, the trend is bullish.
How to use Squeeze Break Indicator?
The fact is that Bollinger Bands and the Keltner Channel react with different sensitivity to increased volatility characteristic of trends.
When the Bollinger Bands are inside the Keltner Channel, the red color of the histogram indicates the absence of a trend.
Accordingly, when Bollinger bands go beyond the Keltner channel, the histogram signals the beginning of a trend. The greater the distance between the Bollinger Bands and the Keltner Channel lines, the larger the bars on the histogram.
The blue line indicating the direction of the trend is nothing more than the classic Momentum technical indicator.
Squeeze Break Indicator Buy signals
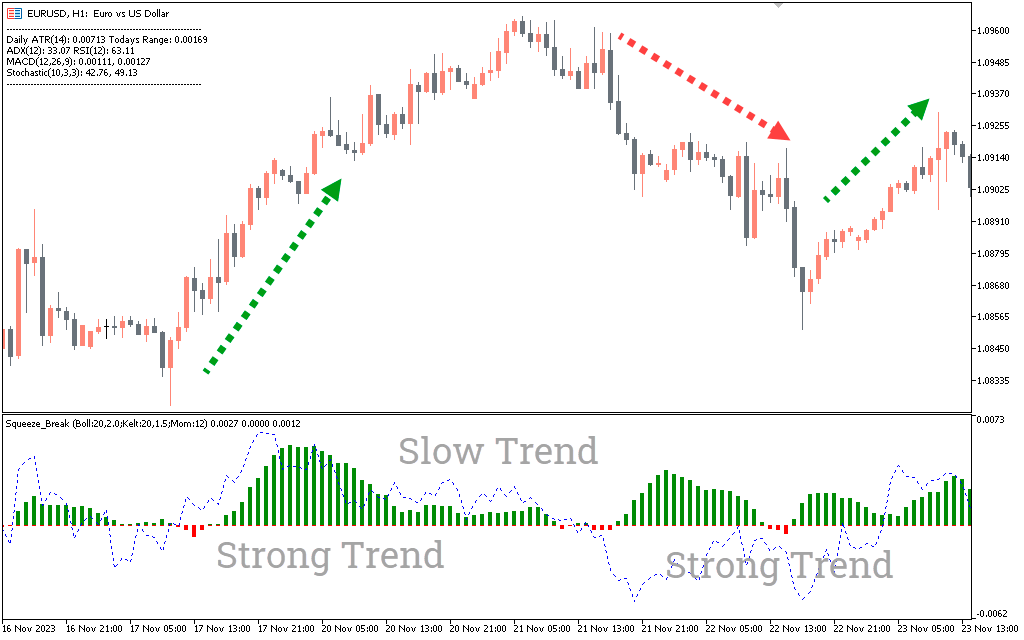
When the histogram bar changes color to green and the blue line is above zero and pointing upward, this is a buy signal.
Hold your position as long as the trend continues and the blue line is above zero. However, in many cases you may not wait for this moment and realize that the momentum has been exhausted. And if you decide to close your position when the histogram and blue line peak, it will be a smart move to preserve your profits.
Sell signals
When the histogram turns green and the blue line is below zero, this is a sell signal. Hold the position as long as the blue line is below zero and the histogram is green. It is not prohibited to close a position when signs of a weakening trend appear.
Conclusion
The Squeeze Break indicator for Metatrader 4 helps you trade in a trend by indicating the beginning and end of a trend, as well as its direction – bullish or bearish. It does not repaint.
This allows you to:
- find trends fully automatically;
- change the settings of the three classic indicators built into the Squeeze Break indicator;
- set the display of additional information;
- set up notifications;
- analyze signals based on history.
Keep in mind that the Squeeze Break indicator for Metatrader does not guarantee the best buy and sell signals. Sometimes it tends to lag and send false signals. However, you can effectively improve the accuracy of signals, for example, if:
- consider combining indicator signals with other technical analysis tools;
- combine signals on the daily chart with signals on the intraday chart;
- Focus on sell signals near resistance zones and buy signals near support zones.
Download this MT5 indicator for free now!