
Snake Force Indicator
The Snake Force Indicator plots histogram bars to identify the direction of the trend.
Description
The Snake Force Indicator uses histogram bars to determine the market trend. It works similarly to the MACD indicator but uses different calculations.
It plots red and green bars. These bars are plotted above or below a zero line. The color of the bars indicates the direction of market momentum.
Although you can use the indicator on sorter timeframes, it’s best to apply it on longer timeframes.
How to use the Snake Force Indicator for MT4?
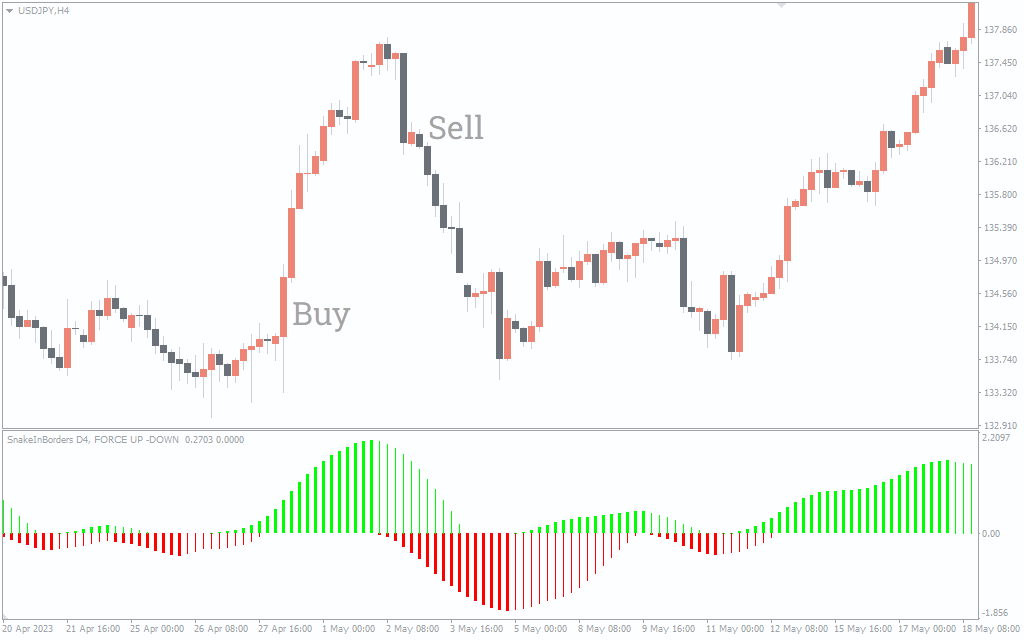
The above USD/JPY H4 chart shows indicator’s BUY/SELL signals. Green bars indicate bullish momentum, while red bars indicate bearish momentum.
When the green histogram bars go above the zero line, it suggests a long entry point. On the flip side, when the red bars o below the zero line, it’s a short entry point.
The indicator can also help in determining market reversals. For example, if green bars turn into red bars, it could indicate a bearish reversal.
Reversals can also be identified by comparing the price action with the Snake Force Indicator. If the price of an asset is making higher highs while the indicator’s histogram bars are making lower highs, it illustrates a bearish divergence.
It’s important to note that the height of the bars on the histogram represents the strength of the market momentum. Taller bars indicate stronger momentum, while shorter bars suggest weaker momentum.
Conclusion
The Snake Force Indicator for MT4 works similarly to the MACD and plots histogram bars to identify the market trend. The red bars indicate bearish momentum and green bars indicate bullish momentum.