RSI Extreme Zone Indicator
RSI Extreme Zone is ideal for determining when a financial instrument is oversold or overbought. An incredible trend detector.
Description
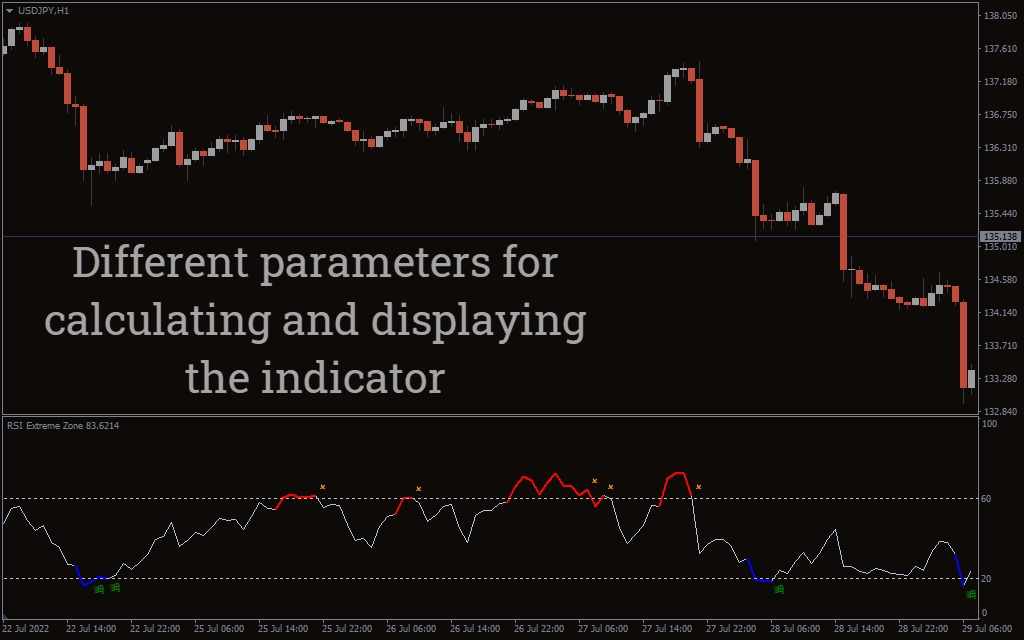
RSI extreme zone is similar to the conventional relative strength index indicator. Essentially the indicator shows the overbought and oversold areas to determine the strength of the market. You can also use the indicator to identify the market direction. When the market rises above the centerline, it indicates the uptrend will continue, while falling below the middle level indicates a continuing downtrend.
But more importantly, the indicator is used to identify trend reversals. Essentially it gives a strong reversal signal when the indicator enters overbought and oversold areas. The general interpretation is that the market will revert once it enters these extreme zones. When the indicator hits the overbought areas, the price will likely reverse and trend downwards. Similarly, the price also reverses and rises when the indicator enters the oversold areas.
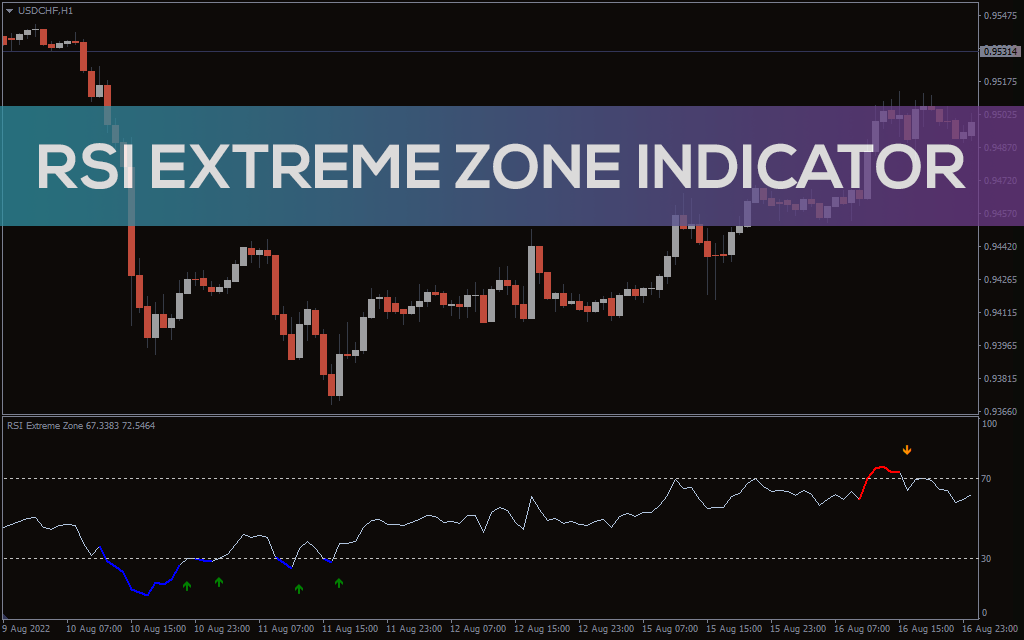
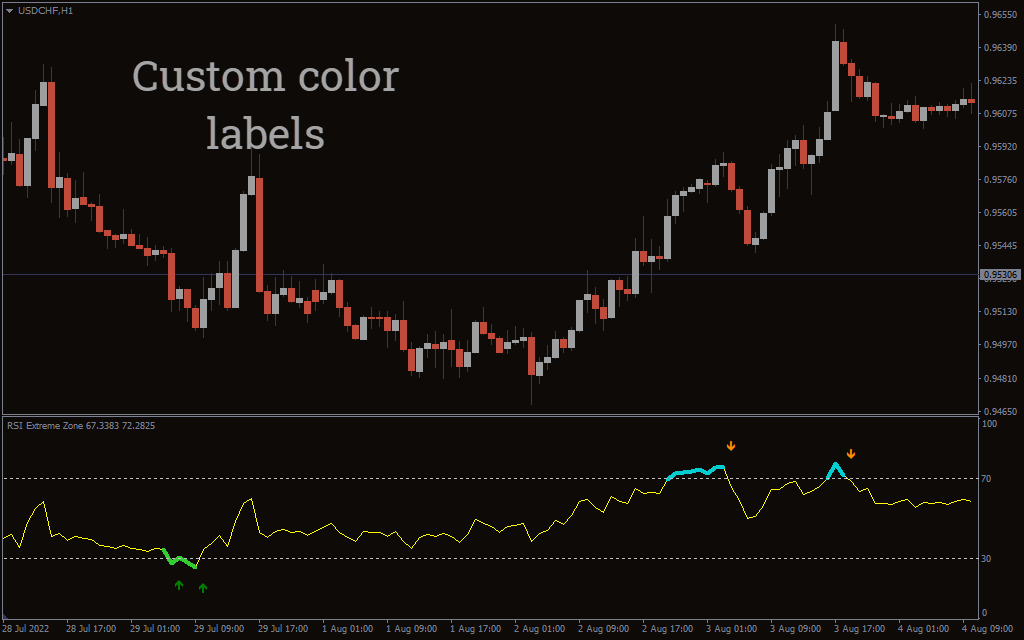
The indicator goes a step and shows the possible reversal points using arrows when the indicator hits extreme levels ( overbought and oversold).
Using the Indicator to Trade
The indicator pretty much gives the trend direction and price reversal signals.
Buy Signal
Wait for the indicator line to enter the oversold region. Buy when the indicator line changes color to blue and posts an arrow indicating a reversal. The best time to enter a long position is just when the trends start.
Sell Signal
The indicator signals a short position when the price enters the overbought area. The indicator line changes color to red and posts an arrow pointing downwards.
Exit Strategy
You should, however, use a suitable exit strategy with clear risk management to limit loss in case the signal fails.
Trading Example
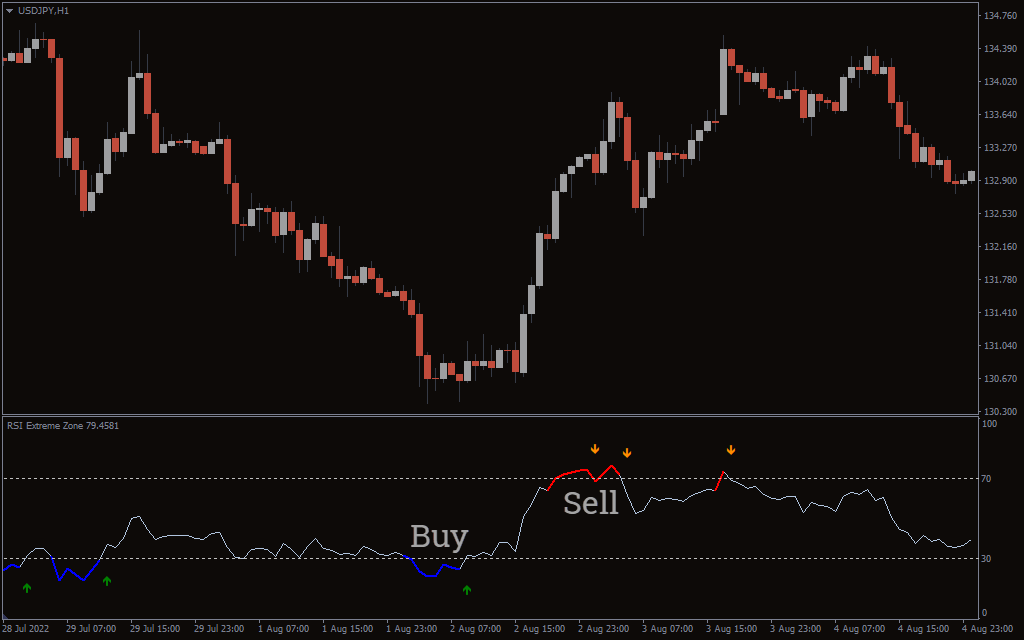
The price action shows the price movement of the US dollar against the Yen. The indicator gives a buy signal when the price action hits an oversold area after a downtrend. Additionally, the indicator line changes color to blue and posts a bullish green arrow.
The price action moves in a smooth uptrend after the signal. In fact, the price moves over 250 pips after the signal. This means that you would have looked at massive profits. Similarly, the indicator gives a buy signal when the price action hits an oversold area after a clear uptrend. The indicator line changes color to red and posts yellow bearish arrows.
Conclusion
The RSI extreme zone is ideal for identifying suitable price reversal points. The indicator gives a sell signal when the price enters an oversold area and the indicator changes color to red. It also posts a yellow arrow should the reversal be imminent. Similarly, the indicator posts a buy signal after entering an oversold area, and the indicator line changes to blue. The Indicator also posts a green arrow signaling an ideal time to enter a bullish position.