ROC Indicator
ROC indicator for MT4.Best oscillator-based Bullish and Bearish forex trading signals. Zero line signal and breakout trading.
Description
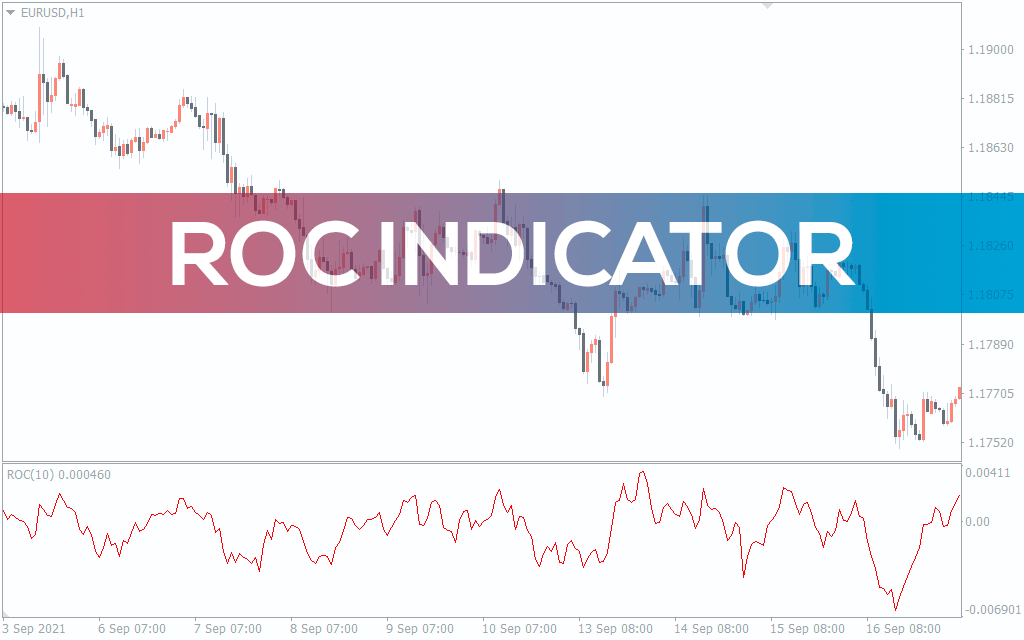
The ROC indicator for MT4 is the Rate Of Change MetaTrader indicator to calculate the rate of price change between the current closing price and the closing price before “n” periods. The indicator provides Bullish and Bearish trend change signals so forex traders can place BUY or SELL trades based on them. We also recommend trying the ROC Multi Currency Indicator and the ROC Smoothed Indicator, which work as excellent companions for traders looking for broader or smoother momentum analysis.
In practice, I found that the sharp crossovers around the zero line were very useful in identifying momentum shifts early, especially when confirmed with price action. One thing that impressed me is how clear the divergences looked — spotting disagreement between price and ROC gave me several high-probability trade setups. However, I also noticed that in fast markets, the ROC can sometimes lag, which is why I prefer combining it with support and resistance or moving averages.
Moreover, the indicator provides divergence and convergence-based forex trading signals. Additionally, forex traders can anticipate reversals and exit early based on the overbought and oversold condition of the oscillator.
The indicator reflects the momentum of the price and helps the trader to interpret the oscillator values and trade the signals in multiple methods. So, the indicator is very helpful for new forex traders to identify entry and exit points.
However, advanced forex traders can apply convergence and divergence techniques and plot support and resistance on the indicator to trade complex technical trading strategies. Since the indicator lacks an upper or lower value limit, advanced traders must use the oversold and overbought conditions with caution. Additionally, the indicator is free to download and easy to install.
ROC Indicator For MT4 Trading Signals
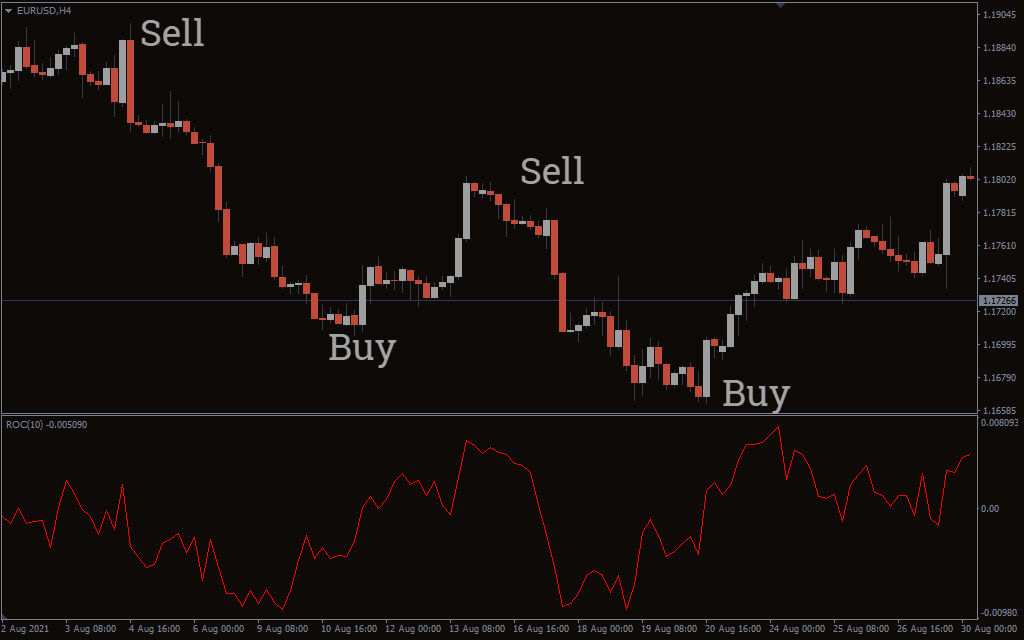
The above EURUSD H4 chart shows the ROC – Rate of change indicator for MT4 in action. The indicator plots the values in RED in a separate indicator window as an oscillator with a Zero line without upper or lower limits.
The primary method to find the trading signals is the zero line crossover of the indicator. If the oscillator crosses the zero line from down to upwards it indicates a BULLISH price trend.
So forex traders can place a BUY trade with a stop loss lower than the previous swing low. The best take profit strategy is to follow the oscillator and stay long as long as the indicator stays above the Zero line. On the other hand, if the oscillator falls below the zero line, it shows the BEARISH market trend. Traders can enter a SELL position with a stop above the previous swing high.
If the oscillator rises sharply higher from the Zero line it indicates a strong BULLISH trend, similarly, a sharp drop from the zero line denotes a stronger BEARISH market trend.
The next important method is to identify divergence and convergence of the price and indicator. Divergence or convergence shows the non-agreement of price and ROC indicator values. So forex traders can use the BULLISH or BEARISH divergence trading strategies to BUY and SELL accordingly.
The third method is to plot Support and Resistance, the basics of technical analysis. Forex traders can plot support and resistance lines and draw channels on the indicator. Forex technical traders can trade the breakouts in confluence with the price action.
Pros and Cons of the ROC Indicator
✅ Pros
- Clear momentum signals: Zero line crossovers make it simple to spot bullish and bearish shifts.
- Divergence detection: Makes it easier to see hidden price/indicator disagreements for high-probability setups.
- Free and easy to install: Works seamlessly on MT4 with no complex setup.
❌ Cons
- Lagging nature: As with most momentum indicators, it can react slowly in fast-moving markets.
- No fixed overbought/oversold zones: Requires trader discretion when interpreting extremes.
- Works best with confluence: Alone it can mislead, so it’s safer to combine with price action or other tools.
Conclusion
The ROC indicator for MT4 provides the opportunity to trade the trading signals using various methods. But traders must approach the forex trading signals of the indicator with caution. The calculations are based only on the rate of change of the closing price. So they have a certain degree of lag in the Bullish and Bearish trading signals. So forex traders should apply other technical indicators and trade with confluence.
For those interested in improving divergence trading strategies further, I recommend reading our blog article How to Identify Divergence in Forex, which fits perfectly alongside the ROC.
Frequently Asked Questions (FAQ)
🎨 Does the ROC indicator repaint?
No, the ROC does not repaint — once a value is plotted, it remains fixed.
📊 Which timeframe is best for using ROC?
It can be applied to any, but H1 and H4 are generally considered the most reliable.
🔎 Is ROC suitable for scalping?
Yes, but traders should combine it with confirmation tools, as signals may be noisy on very short timeframes.
🔰 Can beginners use the ROC effectively?
Yes, its zero line and color-coded plots are easy to understand, though practice is advised.