

Overlay Chart Indicator
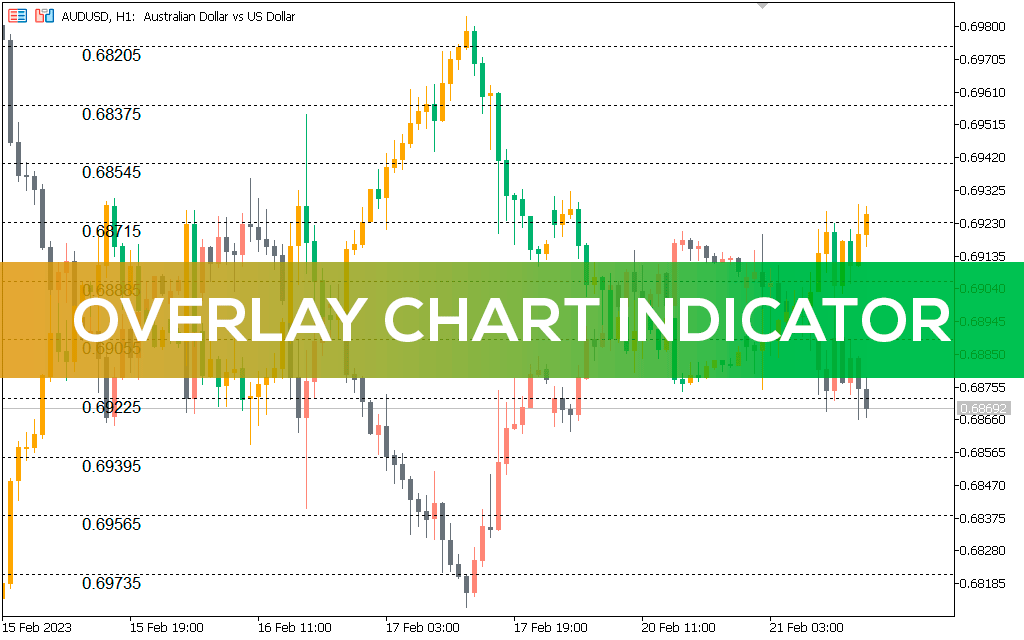
Forex BUY and SELL signals from the best Overlay Chart Indicator. Compare the price action of two forex pairs.
Description
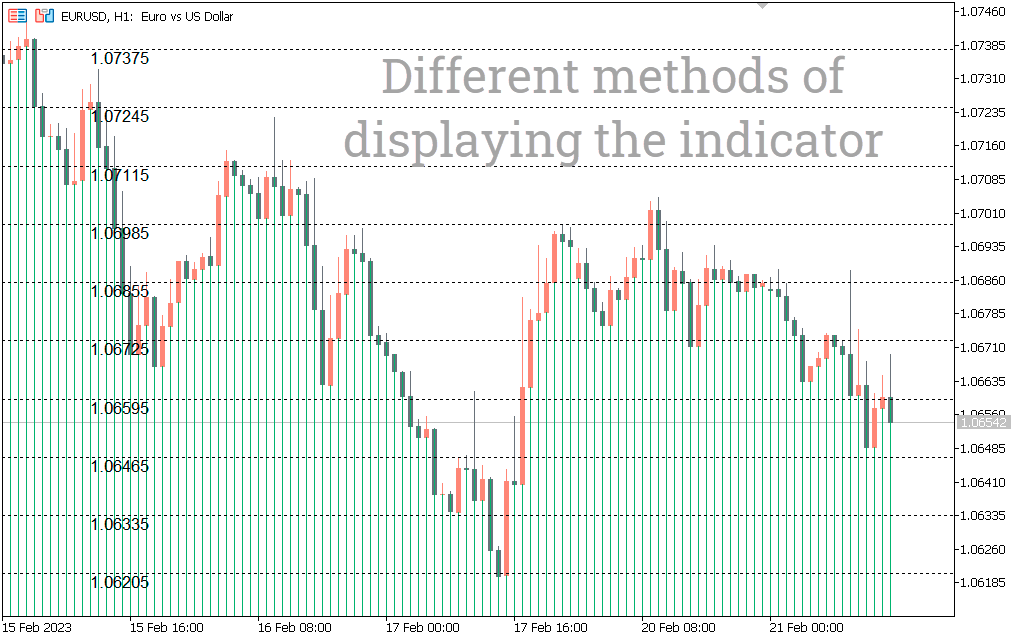
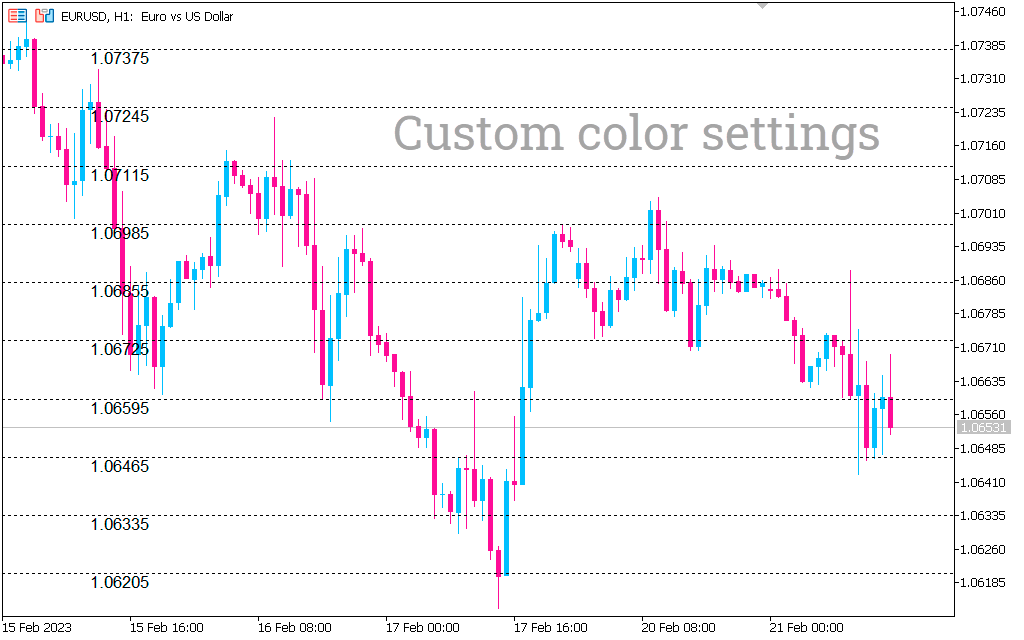
The Overlay Chart Indicator is a simple MT5 indicator that compares the price action of two currency pairs. The indicator plots two prices at the same time to compare the price action of two currency pairs. Along with price action, the indicator also indicates the high, low, open, and close of the pair it overlaps.
You can open positions on both pairs by comparing the two price action. The indicator works on the principle of Forex correlation. In forex, a currency correlation is a positive or negative relationship between two currency pairs. A positive correlation indicates that the two currency pairs are moving in the same direction, while a negative correlation indicates that they are moving in opposite directions.
If two pairs are correlated, the Overlay Chart indicator will apply them simultaneously. While you can use the Overlay Chart indicator on any timeframe, it is best to use it on longer timeframes.
Overlay Chart Indicator BUY/SELL signals
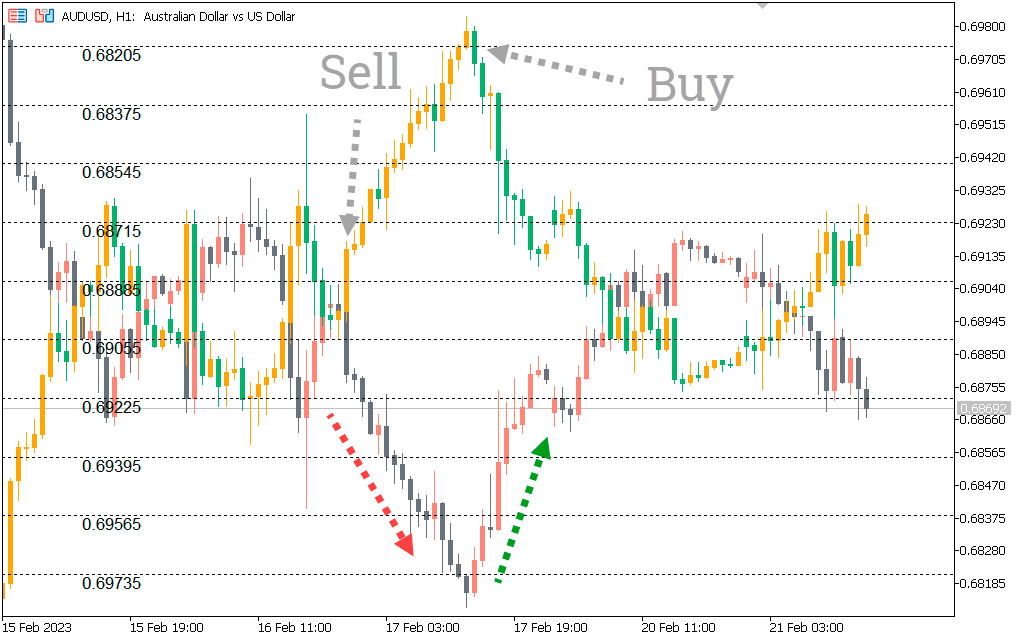
The chart above shows BUY and SELL signals with an indicator. Here USD/CAD is the original pair and USD/JPY is the overlaid pair. To identify BUY and SELL signals, traders need to monitor the price action. The overlay pair has green and orange bars illustrating bullish and bearish signals. Green bars indicate a bullish trend, while orange bars indicate a bearish one.
As for the original pair, traders should watch the price action and open their positions accordingly. The indicator works best, but it is difficult to determine the price movement. Thus, you need to apply other technical indicators such as RSI or MACD to determine the correct entry and exit points.
What is overlay in technical analysis?
Overlay analysis involves placing a price action on top of the current price action. Thus, traders can compare two price actions at the same time. The technical analysis of the overlay is done using indicators such as the chart overlay indicator.
What are overlay indicators?
Overlays indicators display price behavior on top of the current price and thus overlap each other. The indicator overlay works side by side with the original price action and thus traders can open their positions accordingly.
Conclusion
The Overlay Chart indicator places another pair’s price action on top of the original price action. By comparing the two price actions, traders can open their positions accordingly. In addition, you can download the indicator for free on our website.